jps services
  • Home Page
  • GIS Training Courses
    • QGIS Training Courses
    • ArcGIS Training Courses
    • MapInfo Pro Training Courses >
      • MapBasic Training Course
  • About
  • Blog

Using GIS to explore spatial relationships

31/8/2019

0 Comments

 
You can use attribute data attached to individual layers to find out about information relating to projects within your GIS. Additionally, you can also find answers to questions regarding  the spatial relationships of the features within a selection from within the layers.

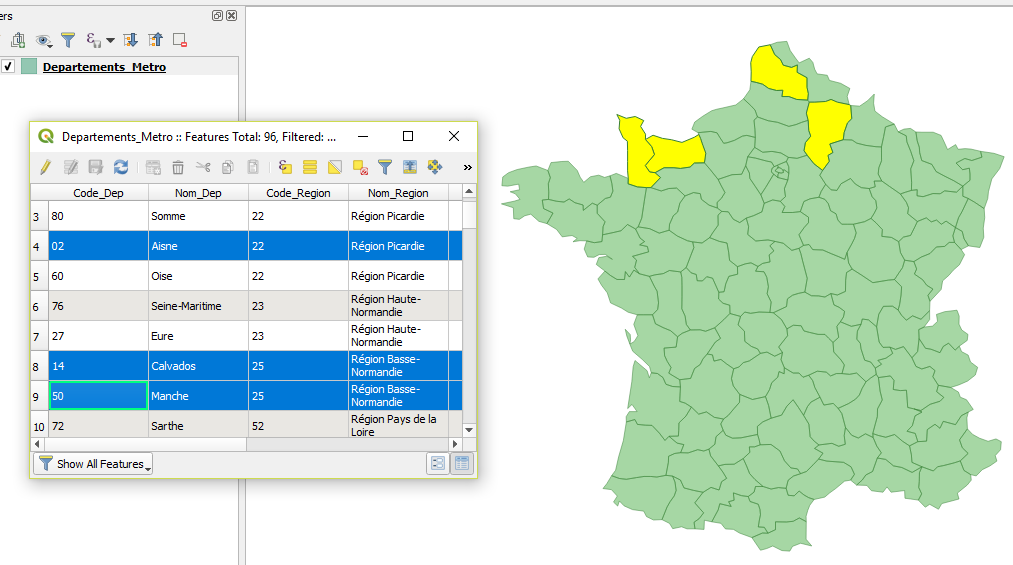
This ability to query spatial relationships enables you to answer questions such as, how many airports are within a region, which rivers cross boundaries, which countries have a common border or how many cities have a population in excess of two million within a specific country.

In the same way GIS can also answer questions about health, income, crime levels and employment within a certain geography.

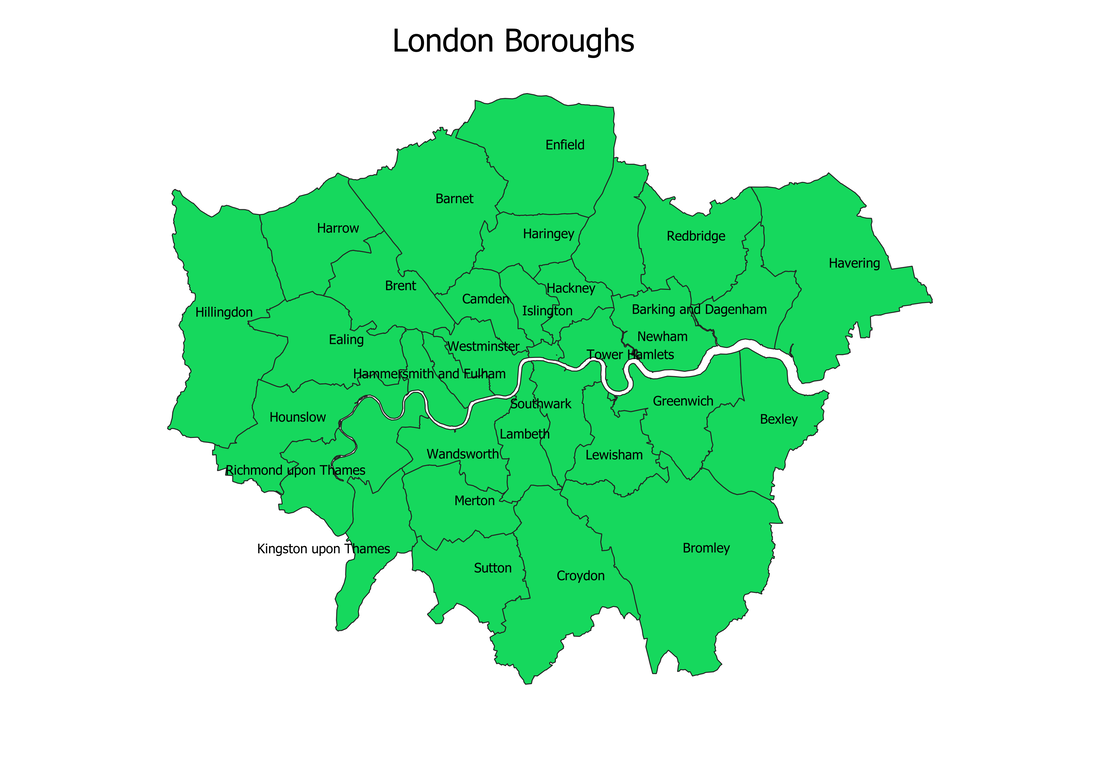
Looking at the London boroughs we could ascertain, with the help of GIS, which are the poorest and which are the most affluent.

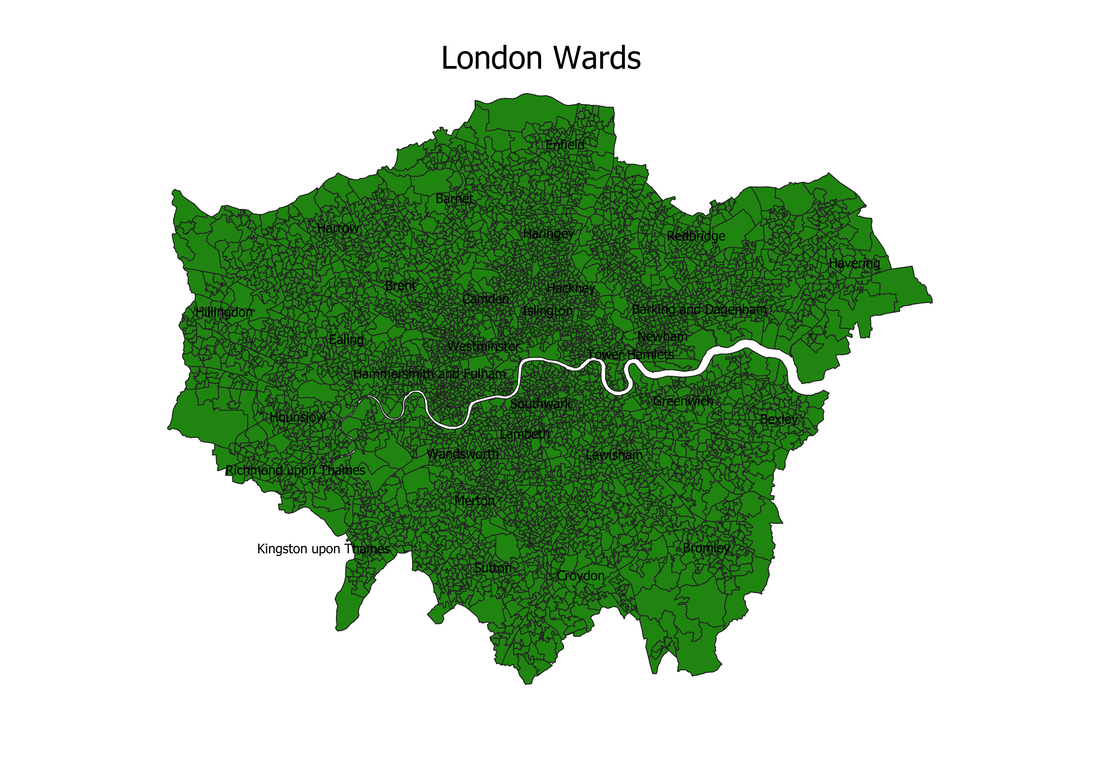
Here is a map of the London wards. There are 4765 ward entries in the attribute table for this map layer.
Picture
If we just wanted to query data at a borough, rather than the ward level, we could use GIS to create a new layer. We could achieve this by using a geoprocessing tool to dissolve the current 4,765 wards into 33 boroughs. This results in a map layer similar to the following screen shot.

Picture
If we also download spreadsheets containing information about health, education, income and employment they could be joined to our London borough map attribute table to give us a picture of each boroughs’ performance.  .

Here is a map showing crime levels across the 33 London boroughs. The darker the colour the higher the crime levels.

Read More
0 Comments

How lines, points and polygons are linked to data within a GIS

19/8/2019

0 Comments

 
Each feature within a GIS has appropriate attribute data attached to it. This data can contain information such as, in the case of a city, its name, size of population and other relevant details.
​
All GIS store data in a format which is commonly referred to as an attribute table. Each layer contains an attribute table which is similar to a spreadsheet layout. Within this table the user can put as much or as little information as is required for the layer’s requirements. Like a spreadsheet the data is stored in a series of rows and columns. Each row represents a single record and each column represents a field within the table. Some tables only contain a few fields with a limited number of columns, whilst other tables, say containing crime statistics, can have thousands of records and numerous fields.

Information within the attribute table is linked to the point, line or polygon within the map layer. Clicking on one or more features in the map layer will also highlight the same features in the attribute table if this has been made visible. Similarly, clicking on one or more rows in the attribute table will highlight these features in the map layer.  
Picture

Read More
0 Comments

The use of scale in a desktop GIS

12/8/2019

0 Comments

 
 Desktop geographical information systems use scale to represent the relationship between the size of elements within the map and the related areas within the real world. In fact it is very similar to the methods used with paper maps. However, paper maps are produced at fixed scales to meet different requirements. This contrasts with the flexibility of a desktop GIS which can produce an infinite variety of maps by adjusting the scale to meet specific requirements.

A ramblers paper map would have a scale which relates more closely to a specific area of interest. A map used for travelling over larger distances by car for example would have a different scale. The only way someone could take a closer look at a detailed paper map would be to use a magnifying glass which would have no impact on the scale of the map. However, with a desktop GIS  there is the capability of zooming into areas of interest which then  automatically adjusts the map scale.

So with a desktop GIS the zoom feature enables users to view maps at a variety of scales. In the following screen shot the map is shown at a world view of 1:186,760,885.  
Picture
In the next screen shot the scale has been changed to 1:13,877,198 as we zoom in to take a closer look at an area including parts of the United States and South America.   
Picture
The effect of zooming in shows that in the above map is now nearly fourteen million times smaller than actual size. The map now has a scale value of 1:13,877,198. The zoomed in area of the map within the GIS has in other words a ratio 1:13,877,198. This represents one unit on the map as almost fourteen million times smaller than in the real world.

We can also indicate the scale of a map by adding a scale bar to maps that are printed. We can set the scale to the desired measurement which could be either metric or imperial. In the following screen shot we have set the scale in kilometers.
Picture
So as we zoom into a map we can obtain a closer view of the map’s features. At different scales we can obtain just the right amount of information for our specific requirements. The ability to create a variety of maps from a single map source is made possible by the flexible scaling features within a modern GIS system. Maps can then be printed at a suitable scale to meet the user’s requirements.
0 Comments

The purpose of layers within a geographical information system

5/8/2019

0 Comments

 
Prior to the availability of computerised mapping facilities paper maps were often used in conjunction with acetate sheets in all forms of mapping applications. At that time the latest paper map of a county or region would have been an expensive outlay. Within the UK, local authorities obtained their paper maps from Ordnance Survey often buying updates several times a year at a cost of thousands of pounds.   
Because the maps were expensive it made sense to ensure that they were well looked after. Sometimes this was achieved by laminating the maps to stop them being damaged by accidental spillages. If additional information was needed to be added to these base printed maps, acetate sheets were used. These acetates were used to mark out, for example, property boundaries or crime incidents. In this way several layers of information could be added without causing any damage to the printed base map.

Today, the modern desktop gis uses the same principal to separate the base map from other information stored within the system. The layer system enables the user to break information down into specific areas of interest. For instance in a map of Alaska all the airports are contained within a separate layer within the gis. This information on its own would not make a great deal of sense without the underlying base map as the following graphic shows.
Picture
Without the underlying Alaskan base map the airport layer does not make a great deal of sense as it is not related to anything meaningful in isolation. In the next graphic the airport layer makes sense as it shown with the relevant base map.
Picture
Maps can have many layers within a project. Layers can be present within the map without being visible. This enables specific areas in the project to be analysed by the map maker. Often a map may contain very many layers and it this case it makes sense to group related layers. In grouping layers you can then more easily manage whether the group is displayed or not. The group of layers can then be turned on or off together rather than manually turning off the related individual layers one at a time.

Some gis systems, such as MapInfo allow placement of points, lines and polygons within the same layer. However, whilst this is possible within MapInfo, if you need to transfer to a different gis you may find this creates problems. Both QGIS and ArcGIS have a layering system which only allows for one type (point, line or polygon) to display within a layer. Transferring data to QGIS from MapInfo with layers containing a mix of types will result in QGIS creating additional layers during the conversion process. Alternatively, MapInfo can convert layers to a shape file format which both QGIS and ArcGIS can then use.

Layers can be in a vector or raster format. Vector layers are either points, lines or polygons which can be in an x and y, or latitude and longitude format. Raster data consists of a series of dots and is often used to represent for example, ocean depths or variations in vegetation growth. In the next screen shot a raster layer has been added to the Alaskan map.
Picture
Layer order is important when displaying data within the map. If the layers are not ordered correctly some layers may not display correctly, if at all. To change the layer order you only need to click on the layer within the layer control section, hold the mouse down and then move the layer up or down to achieve the correct sequence.
0 Comments

    Author

    Joe Short BSc has been involved with various mapping solutions for over twenty years.  If you are considering implementing a GIS  or have ArcGIS Pro, MapInfo Pro or QGIS training requirements, jps services would be happy to be of assistance to your organisation. 

    Archives

    April 2020
    March 2020
    October 2019
    September 2019
    August 2019
    July 2019
    March 2019
    November 2018
    October 2018
    August 2018
    July 2018
    November 2017
    October 2017
    September 2017
    July 2017
    February 2017
    January 2017
    December 2016
    November 2016
    October 2016
    May 2016
    February 2016
    September 2015
    August 2015
    April 2015
    February 2015
    November 2014
    October 2014
    July 2014
    June 2014
    May 2014
    March 2014
    February 2014
    December 2013
    November 2013
    October 2013
    September 2013
    August 2013
    June 2013
    May 2013
    April 2013
    February 2013
    December 2012
    October 2012
    September 2012
    August 2012
    July 2012

    Categories

    All
    Arc Gis
    Arcview
    Autodesk
    Cad
    Gis Training
    Local Government
    Mapbasic
    Mapinfo
    Quantum Gis
    Relational Databases
    Saga Gis

    RSS Feed