jps services
  • Home Page
  • GIS Training Courses
    • QGIS Training Courses
    • ArcGIS Training Courses
    • MapInfo Pro Training Courses >
      • MapBasic Training Course
  • About
  • Blog

ArcGIS: ArcReader, ArcView, ArcEditor and ArcInfo.

17/7/2012

0 Comments

 
ArcGIS Desktop

If you are looking for any kind of consumable you are faced with many different choices in terms of functionality and price.  For instance cars come in many different model options and a wide range of specifications.  In the same way ArcGIS offers a range of software products to meet different user requirements.  

ArcReader is available to download for free from the ESRI website.  With ArcReader you can view and print digital maps created by others.  You can also zoom to various parts of the map to see more detail.

ArcView, now known as ArcGIS for desktop basic,  can create the maps that ArcReader can only view and print.  With ArcGIS for desktop basic, you can query data to find answers to questions about distance and the relationships between the different layers with the map.  

ArcEditor, now known as ArcGIS for desktop standard,  has all the functionality of ArcGIS for desktop basic  and has additional advanced features for editing and data creation.  This version also enables multiple users to edit data simultaneously..

ArcInfo, now known as ArcGIS for desktop advanced,  is the top of the range version with all the functionality of the others plus a full range of spatial analysis tools.  All these products share a common user interface and can freely exchange data and maps.

GIS involves mainly two types of activity.  Map creation, editing and spatial analysis on the one hand and database design and management on the other.  ArcMap handles map creation and analysis and ArcCatalog is the database management application.

Besides these products ESRI has many other specialist products to meet the needs of  GIS professionals whatever their discipline.

Besides the desktop ESRI also has products for users in the field: MobileGIS.  ArcGIS for Server for  internet applications. ArcSDE (Spatial Database Engine) to handle links with a variety of database systems and allows users to share and edit centrally held geographic data.

Finally ArcGIS engine makes it is possible for developers to embed ESRI software within their own software in order to give their users GIS functionality.    
0 Comments

Starting to use a GIS system

11/7/2012

0 Comments

 
Since the arrival of the personal computer the use of paper maps has been replaced with sophisticated geographical information systems.  With a GIS you can study maps in many different ways.  A map of the world can reveal population density, climate zones, energy consumption or  elevation information.  In fact you can use maps and related data to study any part of the globe that interests you.

A map can display information about  countries, rivers, roads, cities.   On a paper map all this information is displayed as a single piece of information.  In a GIS data such as country information is displayed on a separate layer.  In fact within the GIS system a map often can consist of many layers depending on the complexity of the data.

Data displayed within a layer such as a city or river for example is known as a feature. This kind of data is also  known as vector data.  Vector data comes in three formats: points, lines and polygons.  Vector data has both shape and size. For example, in a GIS cities could be represented as points.  Roads and rivers could be represented as lines and land parcels, countries could be represented as polygons.

Apart from layers containing features GIS systems can also display layers with data in a form often referred to as surfaces.  This type of data has a numerical value rather a shape. Surfaces consist  of tiny dots called raster.  Here each dot will represent a piece of information which could refer to depth, as in an ocean layer, or height as in an elevation layer.  Each dot would have a numeric value which could be represented by different colours or shades to represent height, depth or some other value such as temperature.

Each feature on  a map will have a location.  To find a feature on a map the GIS uses a co-ordinate system.  This is represented by a series of parallel and vertical lines which create a grid system.  Within this system each point is represented by an X and Y co-ordinate, similarly a line would have at least two points and a polygon would have at least three points. 

When you look at a paper map you know that the map is representing an area which significantly larger than the map is actually printed.  In order to retain accuracy the map uses a scale to represent the real world.  So a map of the world may be shown at a scale of 1: 1,000,000.  A map of Europe could be shown at a scale of 1:400,000.   In a GIS we can zoom in to an area of interest and this will affect the scale at which the map is drawn. Features will therefore display at different sizes depending on the scale at which we are viewing. To avoid a map becoming cluttered layers can be set up so that they are only visible when a certain scale is reached.  In this way cities, roads and other information such as labelling  can be seen without other features causing confusion.

Besides shape and location a feature such as a road or city can contain much more information.  This data may include for instance population, income or crime statistics.  All this kind of information is stored in a tabular form which can be attached to the layer.  For each feature there is a record or row in the table and a field or column for each piece of attribute data.  This information known as attribute data can be displayed in the map by clicking on the appropriate record in the table.  Through attribute data it is possible to create queries which can be displayed on the map.  For instance population density could be displayed within each country with varying depth of colour depending on size of population.

Relationships between various features can be shown.  This enables queries concerning which features are near other features, which features cross or enclose other features.  For instance which countries share a border or have lakes within their borders.  By analysing data in this way it is possible to create new features from areas which overlap  within other layers which meet specific conditions you have set. 


0 Comments

Disease, maps and geographic information systems

5/7/2012

0 Comments

 
Cholera was a devastating disease which killed thousands in London during the middle of the 1800’s.  Nobody at that time was sure of how this disease was transmitted.  Many felt that it was an air borne disease and  that it was coming from gaseous emissions caused by decaying matter.  Others thought that it was caused  microbes too small to be seen.  The actual cause was eventually discovered through the analytical scientific studies of John Snow.

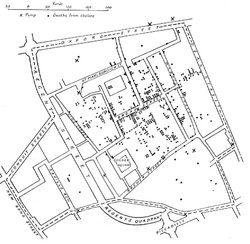
John Snow came from humble labouring origins in York and was  the oldest of nine children.  He took three  apprenticeships with medical practitioners before obtaining  an MA at the University of London in 1844.  He was famous initially for the administration of chloroform to Queen Victoria during the births of her children.  Later when the cholera epidemic struck in 1853-54 he used his considerable intellectual skills to find the cause of the outbreak.  He was convinced that the disease was caused by microbes rather than gaseous emissions.  His views were initially resisted but over time the measures he proposed were accepted.  John noted that between two cholera outbreaks there was a change of water supply which was free from the sewage of London.  He noted that two water companies were supplying pumps within the same area. Through analysis of cholera deaths based on which water supply was used he was able to show that cholera was significantly higher in those drinking water that had been contaminated by sewage.  An outbreak of cholera in August 1854 was associated with a particular pump in Broad Street.  Again through analysis of deaths in the area John was able to show that the contaminated pump was the prime source of the outbreak.

Picture
Cholera deaths near the Broad Street pump
By using maps of the Broad Street area John was able to show in a geographical form how the deaths were directly related to  the pump in that area.  Each death taken from tabular data was shown on the map.  This was an early example of the capabilities of  GIS in that the evidence of how this outbreak occurred could  be more easily understood by the locating each death on a map. 

0 Comments

GIS Training

1/7/2012

0 Comments

 
If you are interested in the development of your GIS knowledge there are numerous facilities available on the internet. Training can take many forms.  For many it may involve class instruction, especially if they work for a company which has invested in a proprietary GIS system such as MapInfo or ArcView.  If you have one of these systems in your organisation you will be able to use the many facilities these software packages afford to manipulate maps and analyse a variety of data related to these maps.  

Since electronic mapping became readily available over the past ten to fifteen years paper maps have taken a back seat in most situations.  Prior to the arrival of the personal computer most organisations would have had to have very large financial budgets to provide a GIS system.  Then GIS was the province of central governments and the largest multi-national companies.  Now, because of the combination of affordable and  powerful personal computer systems,  plus the availability of massive inexpensive storage capabilities  even the smallest of  organisations can afford to have a GIS system.

To make the most of a GIS, whatever system is chosen, it is important to fully understand your requirements to ensure that you successfully  put the system into use.

0 Comments

    Author

    Joe Short BSc has been involved with various mapping solutions for over twenty years.  If you are considering implementing a GIS  or have ArcGIS Pro, MapInfo Pro or QGIS training requirements, jps services would be happy to be of assistance to your organisation. 

    Archives

    April 2020
    March 2020
    October 2019
    September 2019
    August 2019
    July 2019
    March 2019
    November 2018
    October 2018
    August 2018
    July 2018
    November 2017
    October 2017
    September 2017
    July 2017
    February 2017
    January 2017
    December 2016
    November 2016
    October 2016
    May 2016
    February 2016
    September 2015
    August 2015
    April 2015
    February 2015
    November 2014
    October 2014
    July 2014
    June 2014
    May 2014
    March 2014
    February 2014
    December 2013
    November 2013
    October 2013
    September 2013
    August 2013
    June 2013
    May 2013
    April 2013
    February 2013
    December 2012
    October 2012
    September 2012
    August 2012
    July 2012

    Categories

    All
    Arc Gis
    Arcview
    Autodesk
    Cad
    Gis Training
    Local Government
    Mapbasic
    Mapinfo
    Quantum Gis
    Relational Databases
    Saga Gis

    RSS Feed