Prior to the availability of computerised mapping facilities paper maps were often used in conjunction with acetate sheets in all forms of mapping applications. At that time the latest paper map of a county or region would have been an expensive outlay. Within the UK, local authorities obtained their paper maps from Ordnance Survey often buying updates several times a year at a cost of thousands of pounds.
Because the maps were expensive it made sense to ensure that they were well looked after. Sometimes this was achieved by laminating the maps to stop them being damaged by accidental spillages. If additional information was needed to be added to these base printed maps, acetate sheets were used. These acetates were used to mark out, for example, property boundaries or crime incidents. In this way several layers of information could be added without causing any damage to the printed base map.
Today, the modern desktop gis uses the same principal to separate the base map from other information stored within the system. The layer system enables the user to break information down into specific areas of interest. For instance in a map of Alaska all the airports are contained within a separate layer within the gis. This information on its own would not make a great deal of sense without the underlying base map as the following graphic shows.
Today, the modern desktop gis uses the same principal to separate the base map from other information stored within the system. The layer system enables the user to break information down into specific areas of interest. For instance in a map of Alaska all the airports are contained within a separate layer within the gis. This information on its own would not make a great deal of sense without the underlying base map as the following graphic shows.
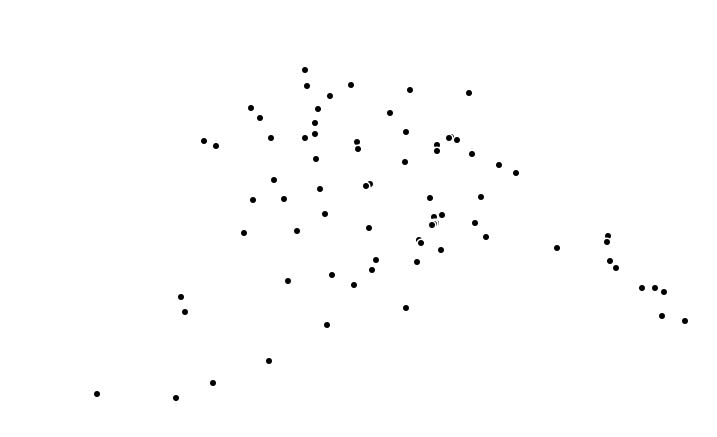
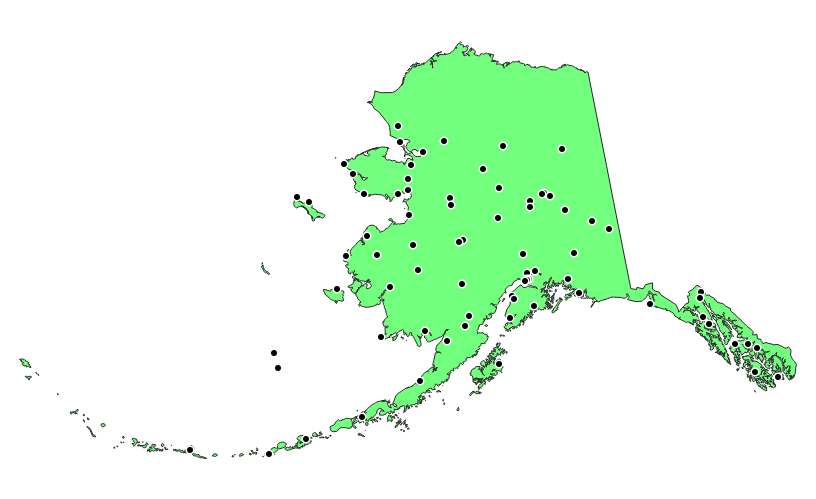
Without the underlying Alaskan base map the airport layer does not make a great deal of sense as it is not related to anything meaningful in isolation. In the next graphic the airport layer makes sense as it shown with the relevant base map.
Maps can have many layers within a project. Layers can be present within the map without being visible. This enables specific areas in the project to be analysed by the map maker. Often a map may contain very many layers and it this case it makes sense to group related layers. In grouping layers you can then more easily manage whether the group is displayed or not. The group of layers can then be turned on or off together rather than manually turning off the related individual layers one at a time.
Some gis systems, such as MapInfo allow placement of points, lines and polygons within the same layer. However, whilst this is possible within MapInfo, if you need to transfer to a different gis you may find this creates problems. Both QGIS and ArcGIS have a layering system which only allows for one type (point, line or polygon) to display within a layer. Transferring data to QGIS from MapInfo with layers containing a mix of types will result in QGIS creating additional layers during the conversion process. Alternatively, MapInfo can convert layers to a shape file format which both QGIS and ArcGIS can then use.
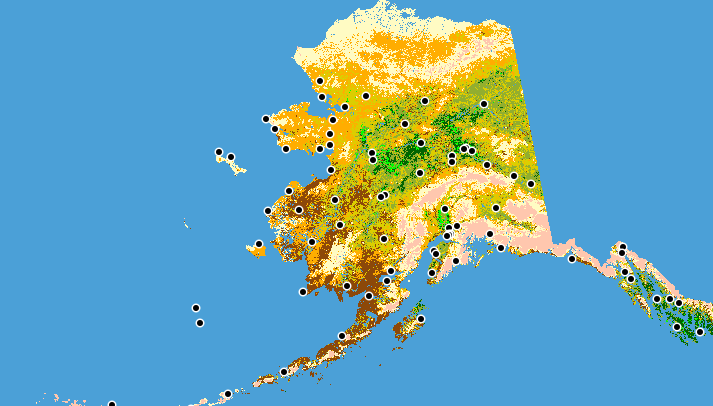
Layers can be in a vector or raster format. Vector layers are either points, lines or polygons which can be in an x and y, or latitude and longitude format. Raster data consists of a series of dots and is often used to represent for example, ocean depths or variations in vegetation growth. In the next screen shot a raster layer has been added to the Alaskan map.
Some gis systems, such as MapInfo allow placement of points, lines and polygons within the same layer. However, whilst this is possible within MapInfo, if you need to transfer to a different gis you may find this creates problems. Both QGIS and ArcGIS have a layering system which only allows for one type (point, line or polygon) to display within a layer. Transferring data to QGIS from MapInfo with layers containing a mix of types will result in QGIS creating additional layers during the conversion process. Alternatively, MapInfo can convert layers to a shape file format which both QGIS and ArcGIS can then use.
Layers can be in a vector or raster format. Vector layers are either points, lines or polygons which can be in an x and y, or latitude and longitude format. Raster data consists of a series of dots and is often used to represent for example, ocean depths or variations in vegetation growth. In the next screen shot a raster layer has been added to the Alaskan map.
Layer order is important when displaying data within the map. If the layers are not ordered correctly some layers may not display correctly, if at all. To change the layer order you only need to click on the layer within the layer control section, hold the mouse down and then move the layer up or down to achieve the correct sequence.
 RSS Feed