Desktop geographical information systems use scale to represent the relationship between the size of elements within the map and the related areas within the real world. In fact it is very similar to the methods used with paper maps. However, paper maps are produced at fixed scales to meet different requirements. This contrasts with the flexibility of a desktop GIS which can produce an infinite variety of maps by adjusting the scale to meet specific requirements.
A ramblers paper map would have a scale which relates more closely to a specific area of interest. A map used for travelling over larger distances by car for example would have a different scale. The only way someone could take a closer look at a detailed paper map would be to use a magnifying glass which would have no impact on the scale of the map. However, with a desktop GIS there is the capability of zooming into areas of interest which then automatically adjusts the map scale.
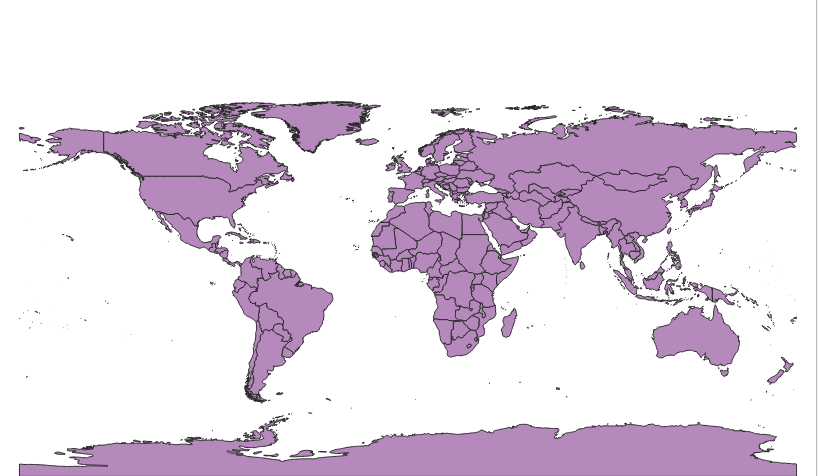
So with a desktop GIS the zoom feature enables users to view maps at a variety of scales. In the following screen shot the map is shown at a world view of 1:186,760,885.
A ramblers paper map would have a scale which relates more closely to a specific area of interest. A map used for travelling over larger distances by car for example would have a different scale. The only way someone could take a closer look at a detailed paper map would be to use a magnifying glass which would have no impact on the scale of the map. However, with a desktop GIS there is the capability of zooming into areas of interest which then automatically adjusts the map scale.
So with a desktop GIS the zoom feature enables users to view maps at a variety of scales. In the following screen shot the map is shown at a world view of 1:186,760,885.
In the next screen shot the scale has been changed to 1:13,877,198 as we zoom in to take a closer look at an area including parts of the United States and South America.
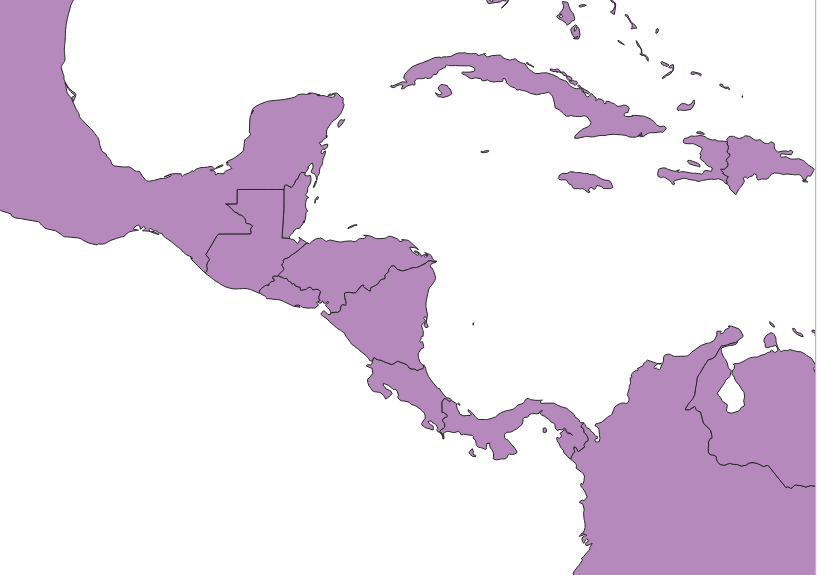
The effect of zooming in shows that in the above map is now nearly fourteen million times smaller than actual size. The map now has a scale value of 1:13,877,198. The zoomed in area of the map within the GIS has in other words a ratio 1:13,877,198. This represents one unit on the map as almost fourteen million times smaller than in the real world.
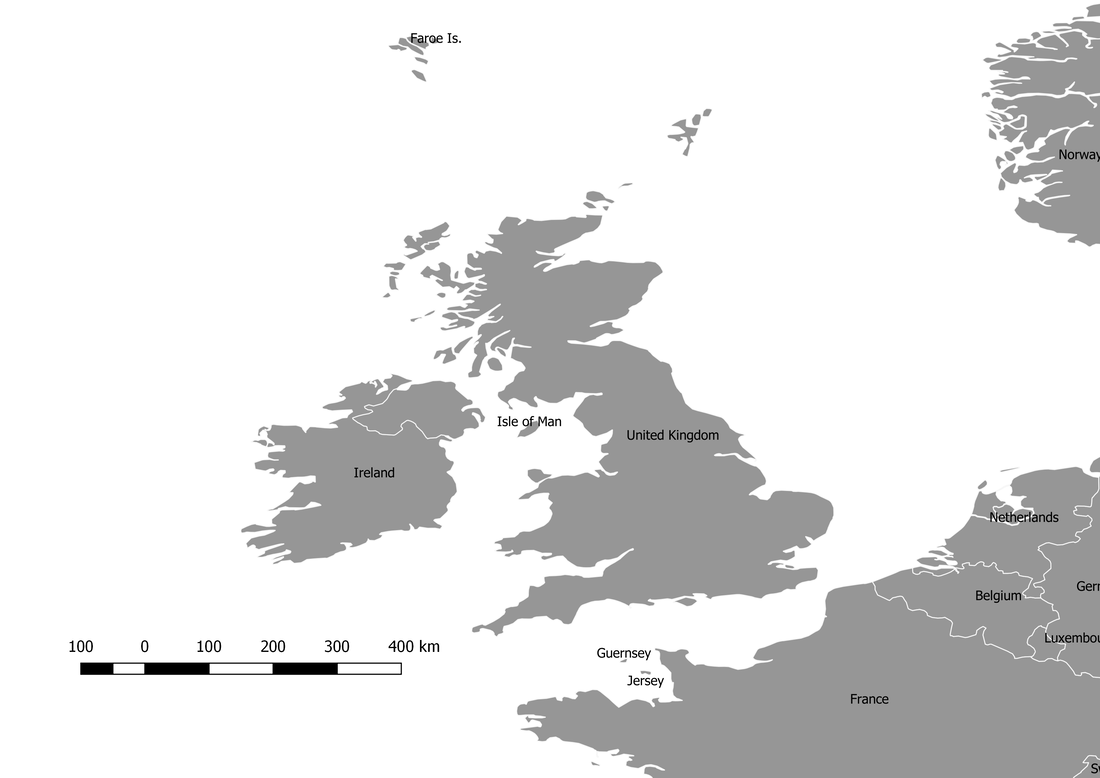
We can also indicate the scale of a map by adding a scale bar to maps that are printed. We can set the scale to the desired measurement which could be either metric or imperial. In the following screen shot we have set the scale in kilometers.
We can also indicate the scale of a map by adding a scale bar to maps that are printed. We can set the scale to the desired measurement which could be either metric or imperial. In the following screen shot we have set the scale in kilometers.
So as we zoom into a map we can obtain a closer view of the map’s features. At different scales we can obtain just the right amount of information for our specific requirements. The ability to create a variety of maps from a single map source is made possible by the flexible scaling features within a modern GIS system. Maps can then be printed at a suitable scale to meet the user’s requirements.
 RSS Feed