jps services
  • Home Page
  • GIS Training Courses
    • QGIS Training Courses
    • ArcGIS Training Courses
    • MapInfo Pro Training Courses >
      • MapBasic Training Course
  • About
  • Blog

Standard methods of feature classification  

28/2/2014

0 Comments

 
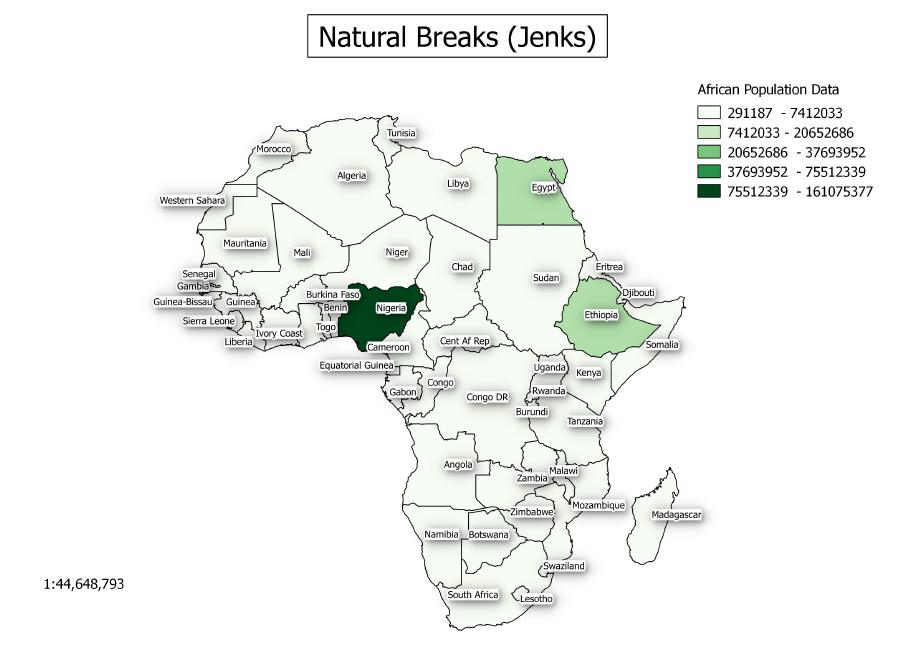
Desktop GIS software such as ArcGIS, MapInfo and QGIS offer a number of classification methods. The most commonly featured are Natural Breaks (Jenks), Equal Interval, Quantile, Standard Deviation and Manual.
Natural Breaks was developed by George Jenks. This method uses clusters and gaps in the data to create classes.
Natural Breaks (Jenks)

Read More
0 Comments

Thematic mapping

24/2/2014

0 Comments

 
The attribute tables attached to your map layers enable you to create different representations of your data. The numerical data within the attribute table can be displayed in a number of different ways through a thematic layer. Displaying data by dividing values into groups requires you think of size of the classes and how you wish to display them by one of several methods available within your GIS software.
If, for example, you are using graduated colours to represent population data,  you have a number of different options. both in the number of classes you have and the mode by which you calculate them.   Equal Interval, Quantile, Natural Breaks, Standard Deviation and Manual being some of the most common options.

Read More
0 Comments

Applying symbology to maps

20/2/2014

0 Comments

 
When you first load a vector layer into your map it will be assigned a default colour. For instance, if you have a outline map of the UK, in a vector polygon format, it will load with a different colour each time you bring it into your map. Vector maps are built up from a combination of point, line and polygon layers. QGIS and ArcGIS only allow a layer to contain either point, line or polygon objects. MapInfo is different in that it will allow vector data for more than one object type to be present within the same layer. You can still import a MapInfo tab file, containing a layer with more than just one object type present, directly into QGIS. QGIS will check to see if more than one object type is present within the MapInfo layer and will then separate the various object types into separate point, line and polygon layers.

Read More
0 Comments

GIS Training: The differences and similarities of popular GIS browsers

19/2/2014

0 Comments

 
Whilst GIS browser facilities, which are now available for ArcGIS, MapInfo and QGIS, have similar functionality they also have a few differentiating features. These features reflect basic differences in how these different GIS software solutions operate.

For instance, ArcGIS has what is known as a data view. In the data view you have the map display together with a table of contents. ArcGIS can support multiple data views within the map display. However only one data view can be active at a time. As well as data views there is also a separate layout view. In the layout view you can see your map as it would appear prior to being sent to a printer. Unlike the data view you can have multiple data view frames visible within the layout view. With ArcCatalog, the ArcGIS browser, you can drag vector and raster layer information into either your data view or your layout view. When you drag a vector layer into a data or layout view it will initially be assigned a random colour. You can of course modify the layer once you have loaded it.  

Read More
0 Comments

GIS Training: Desktop GIS browsers

18/2/2014

0 Comments

 
If you use Microsoft Windows software you are probably familiar with Internet Explorer which is the default file management system. Whilst this system of file management is more than adequate for most applications ESRI decided some time ago to develop an alternative which would offer a more comprehensive facility for ArcGIS users. This software is called ArcCatalog and allows you to, among other things,  to preview maps and related data. Within ArcGIS v10 there is now also a version of the Catalog function included as part of the interface. This version of Catalog is designed to complement the separate ArcCatalog software facility. 

Read More
0 Comments

GIS Training: Attribute tables

17/2/2014

0 Comments

 
Often your points, lines and polygons have considerably more data attached to them than can be realistically displayed on a map. This information is stored in an attribute table which is linked to a vector layer. Within the attribute table the data is stored in rows (records) and columns (fields) and this information can be queried in a number of different ways.

For instance if you use the Identify Features tool within the map to bring up the attribute data on a particular object you are then viewing the related row stored within the table. Similary clicking on rows within the attribute table will highlight the relevant objects within your map.

Read More
0 Comments

GIS Training: Map navigation

15/2/2014

0 Comments

 
If you want to examine a specific area of your map you have a selection of tools to help you. You can activate the Zoom in tool which is usually represented as a magnifying glass containing a plus sign. By clicking on the map the Zoom in tool will increase magnification, usually by two or three times, based on the settings within your GIS software. Alternatively you can create a box with the help of your mouse to zoom in to an area of interest. Depending again on your settings, the layer may show label information if this layer has been set up to be scale dependent. For instance, these settings are usually found within the Layers Properties dialogue box. Here you can decide whether labels display based upon a preset scale. This ensures that your map does not look too cluttered when you zoom out. Once you have zoomed into an area of interest you can use the Pan tool to move about this area of your map. There is also the option of a Zoom and Pan tool in some GIS software packages. This tool enables you to have the combined functionality to either Zoom in or out and Pan whilst using this specific option.

Read More
0 Comments

GIS Training: Viewing and navigating maps

14/2/2014

0 Comments

 
Most popular GIS desktop software have similar methods of displaying and navigating maps. Moving about the map window will usually be achieved with the aid of the mouse coupled with options from a tool bar offering zoom and pan facilities. With these tools you can zoom in and out of areas you wish to study. Additionally, you can also pan across the map window  to view particular sections of interest.

Within a GIS, the table of contents, usually positioned on the left side of the map window, contains the names of the layers available within the map. QGIS, ArcGIS and MapInfo all now provide for the table of contents to be a permanently visible feature within the main mapping environment.  MapInfo does differ from QGIS and ArcGIS in that it also has the ability to open numerous map and attribute windows within a MapInfo work session. QGIS and ArcGIS both allow for more than one attribute window to be open in a ArcGIS map document or QGIS project file. However, only one map window is available at a time within the mapping environment. If you have been used to working with either the  QGIS or ArcGIS interfaces you may need some time to become accustomed to MapInfo's ability to open multiple map and attribute windows within a MapInfo work session.

Read More
0 Comments

GIS Training: An overview of desktop GIS  

13/2/2014

0 Comments

 
A desktop GIS is an application for showing maps and interrogating them. Through analysis of maps you are able to answer a variety of questions of a geographical nature. With a desktop GIS you create maps which give answers pertinent to what is being investigated.
Modern GIS solutions provide a map window for viewing your spatial data. Most will automatically provide a table of contents listing the layers being displayed in the map. Manipulation of the map data is achieved through menus, toolbars and dialogue boxes. Many GIS solutions are customisable so that only the features which you commonly use are displayed. With the latest versions of Windows various toolbars and dialogue boxes can be automatically docked to suit your requirements. Both MapInfo and ArcGIS can use these latest Windows facilities when docking, pinning, displaying and hiding dialogue boxes. Any Windows based solution can also have toolbars either docked or floating to suit individual requirements. Again, most GIS solutions will also save your preferences when you close the software. On opening again these same settings will then be restored rather than the default.

Read More
0 Comments

GIS Training:  Asking questions about spatial relationships

12/2/2014

0 Comments

 
With the attribute data associated with a layer within your map  it is possible to ask many questions and have them answered. This can be achieved through the functionality available within desktop GIS. These questions could include relationships between features, also known as objects, within the map layers.  

Read More
0 Comments
<<Previous

    Author

    Joe Short BSc has been involved with various mapping solutions for over twenty years.  If you are considering implementing a GIS  or have ArcGIS Pro, MapInfo Pro or QGIS training requirements, jps services would be happy to be of assistance to your organisation. 

    Archives

    April 2020
    March 2020
    October 2019
    September 2019
    August 2019
    July 2019
    March 2019
    November 2018
    October 2018
    August 2018
    July 2018
    November 2017
    October 2017
    September 2017
    July 2017
    February 2017
    January 2017
    December 2016
    November 2016
    October 2016
    May 2016
    February 2016
    September 2015
    August 2015
    April 2015
    February 2015
    November 2014
    October 2014
    July 2014
    June 2014
    May 2014
    March 2014
    February 2014
    December 2013
    November 2013
    October 2013
    September 2013
    August 2013
    June 2013
    May 2013
    April 2013
    February 2013
    December 2012
    October 2012
    September 2012
    August 2012
    July 2012

    Categories

    All
    Arc Gis
    Arcview
    Autodesk
    Cad
    Gis Training
    Local Government
    Mapbasic
    Mapinfo
    Quantum Gis
    Relational Databases
    Saga Gis

    RSS Feed