The basic concepts of desktop GIS software haven’t really changed very much since their inception with MapInfo Pro software some thirty years ago. The original designers of desktop mapping software wanted to use the new Windows operating system to emulate the functionality only previously available with the help of skilled cartographers.
The concept these early designers wanted was to emulate paper map creation but in a digital format. One of the main ways they achieved this was by using a process whereby each element of the map could be built up through creating a series of layers prior to printing the final output. Features which we now take for granted such as zooming and panning where at that stage innovative and novel to new users of GIS software.
If we look at a screen shot from QGIS we can see that the map area is displaying a map of Mexico. On the Layers panel on the left side there are five separate layers shown. Each layer represents data in either a point, line or polygon format. All of these layers are in a vector data format.
Vector data could be defined as a list of values. For example, a point has a pair of x and y co-ordinates, a line has two pairs of x and y co-ordinates and a polygon has points where the first and last co-ordinates are joined to create an enclosure.
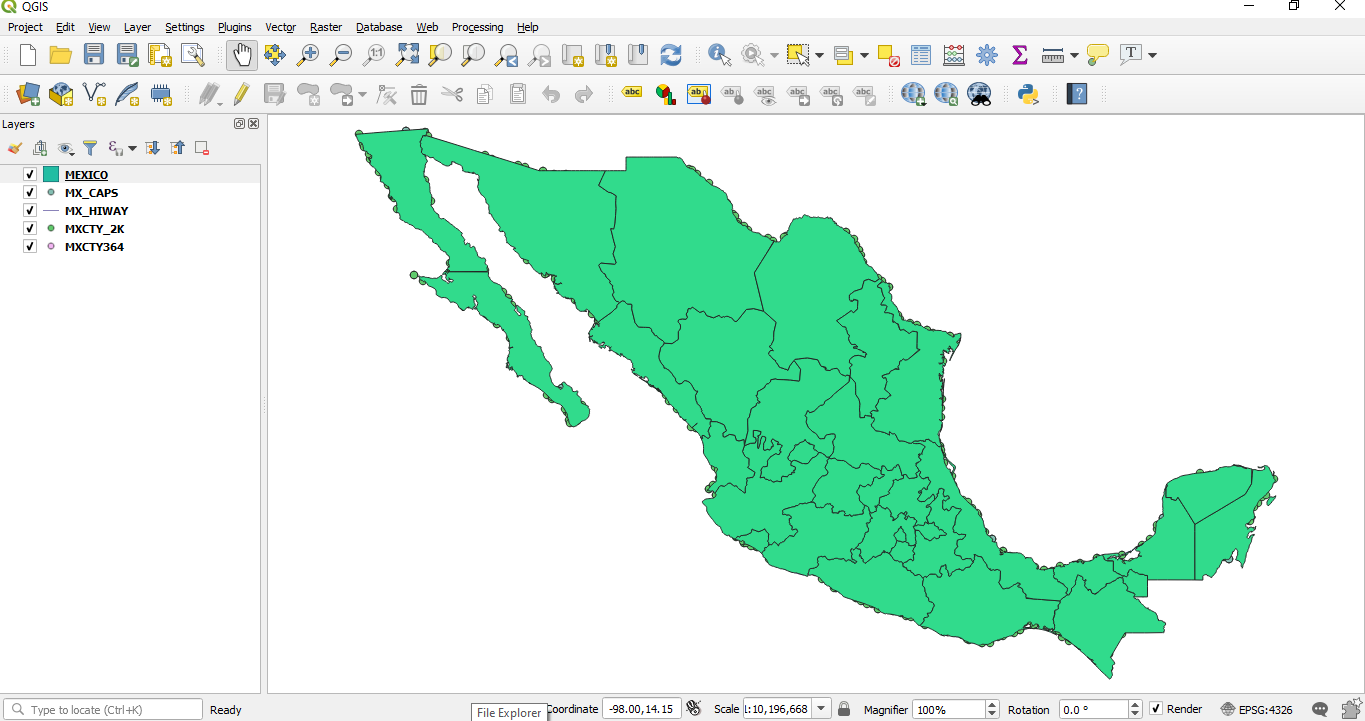
The layers have been brought into QGIS as individual layers which means they will display in a random colour. If these layers had been brought in as a project file each layers’ defined colour scheme would have been preserved.
The next thing to note is that although we have five layers only one layer is currently displaying. This is because top polygon MEXICO layer is hiding the features of the other layers. Again, if this had been loaded as a project file the correct layer order would have been preserved.
Clicking on the MEXICO layer and moving it as shown in the next screen shot will reveal the other layers’ details.
 RSS Feed