jps services
  • Home Page
  • GIS Training Courses
    • QGIS Training Courses
    • ArcGIS Training Courses
    • MapInfo Pro Training Courses >
      • MapBasic Training Course
  • About
  • Blog

Using GIS to explore spatial relationships

31/8/2019

0 Comments

 
You can use attribute data attached to individual layers to find out about information relating to projects within your GIS. Additionally, you can also find answers to questions regarding  the spatial relationships of the features within a selection from within the layers.

This ability to query spatial relationships enables you to answer questions such as, how many airports are within a region, which rivers cross boundaries, which countries have a common border or how many cities have a population in excess of two million within a specific country.

In the same way GIS can also answer questions about health, income, crime levels and employment within a certain geography.

Looking at the London boroughs we could ascertain, with the help of GIS, which are the poorest and which are the most affluent.

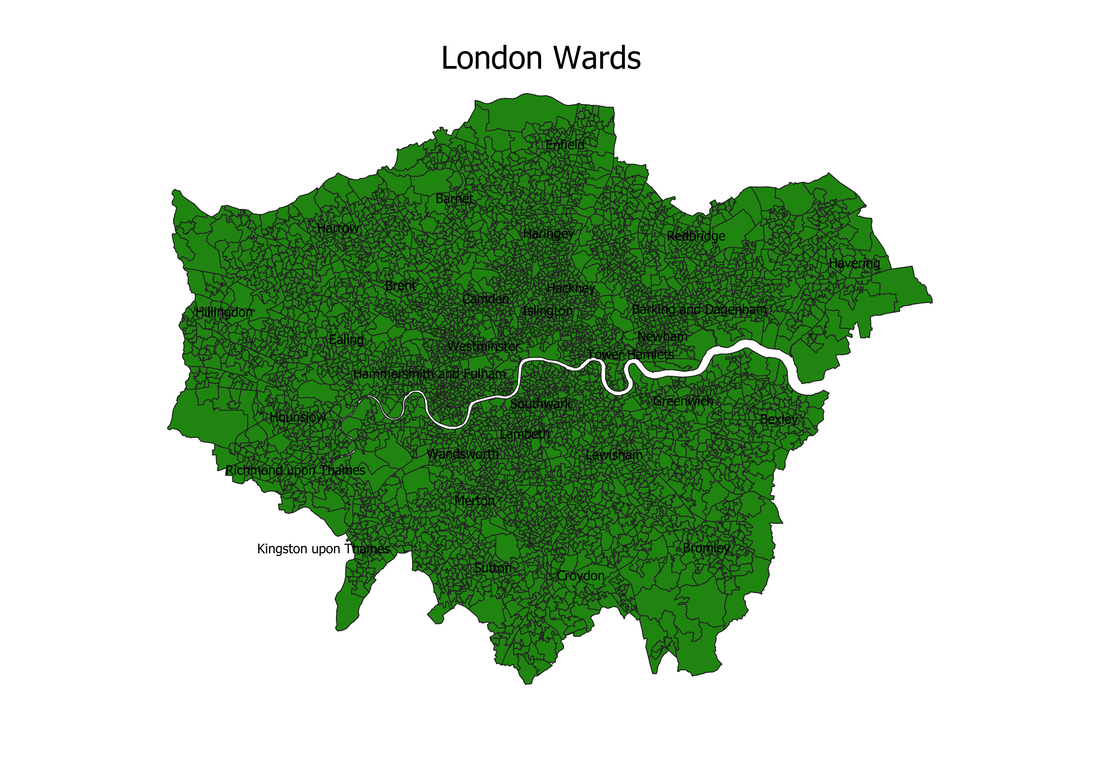
Here is a map of the London wards. There are 4765 ward entries in the attribute table for this map layer.
Picture
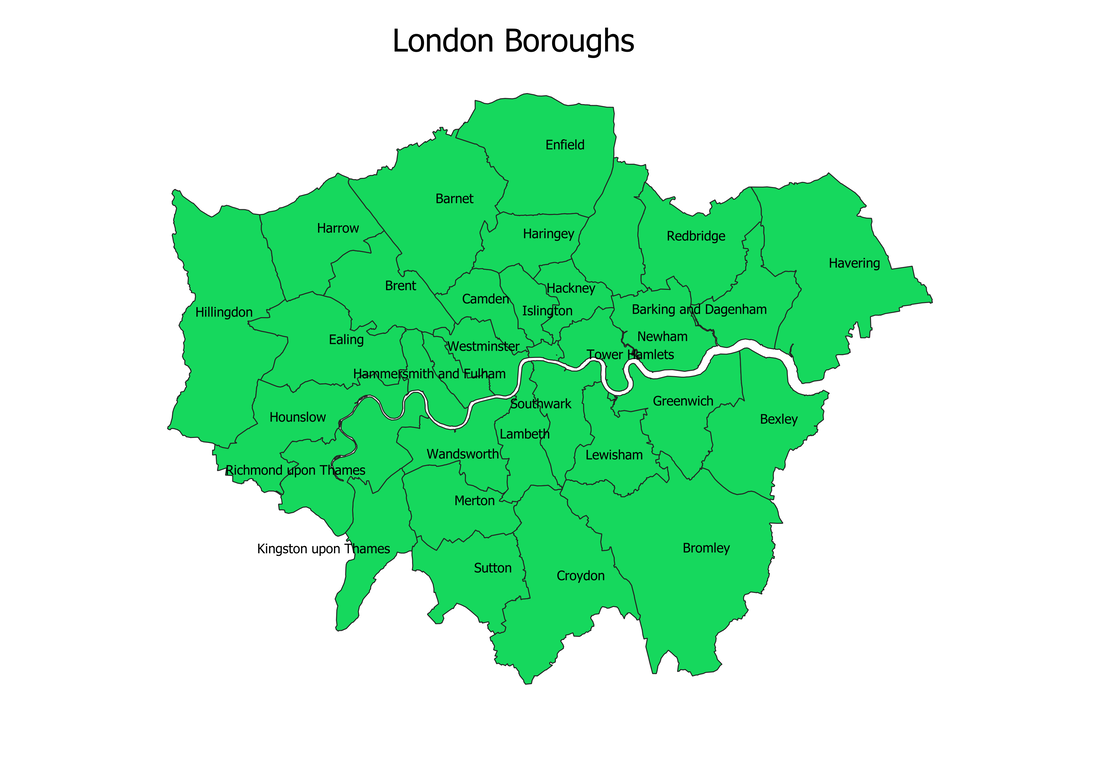
If we just wanted to query data at a borough, rather than the ward level, we could use GIS to create a new layer. We could achieve this by using a geoprocessing tool to dissolve the current 4,765 wards into 33 boroughs. This results in a map layer similar to the following screen shot.

Picture
If we also download spreadsheets containing information about health, education, income and employment they could be joined to our London borough map attribute table to give us a picture of each boroughs’ performance.  .

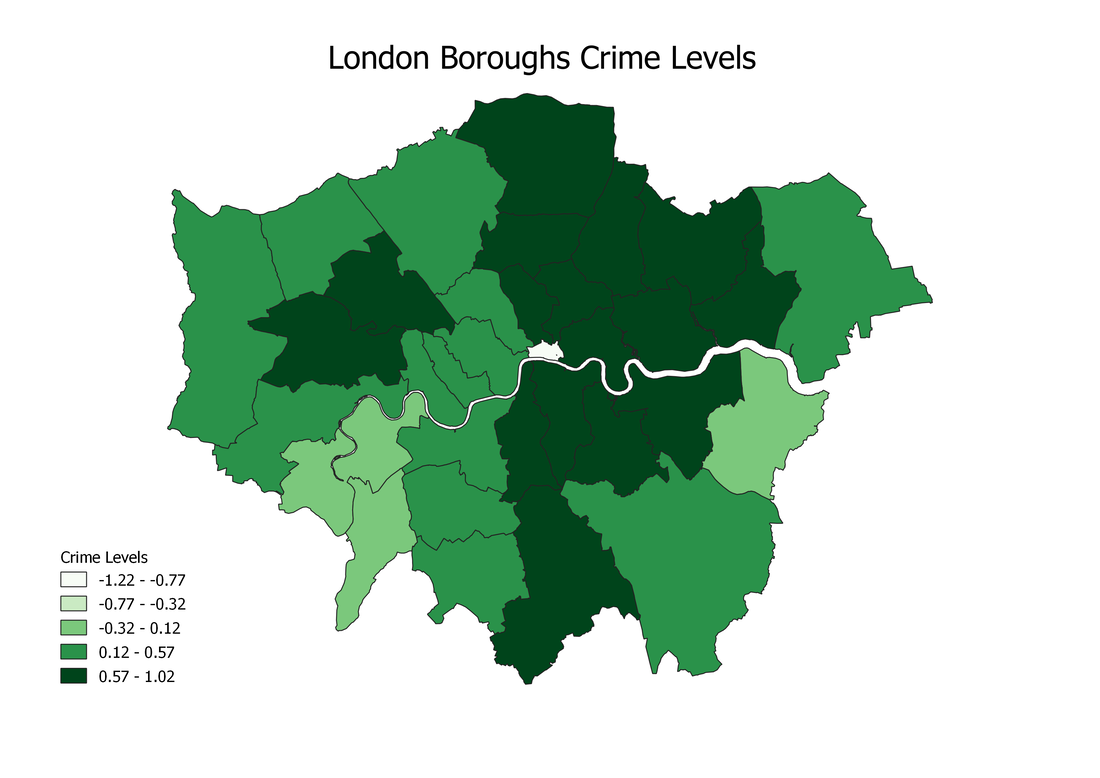
Here is a map showing crime levels across the 33 London boroughs. The darker the colour the higher the crime levels.
Picture
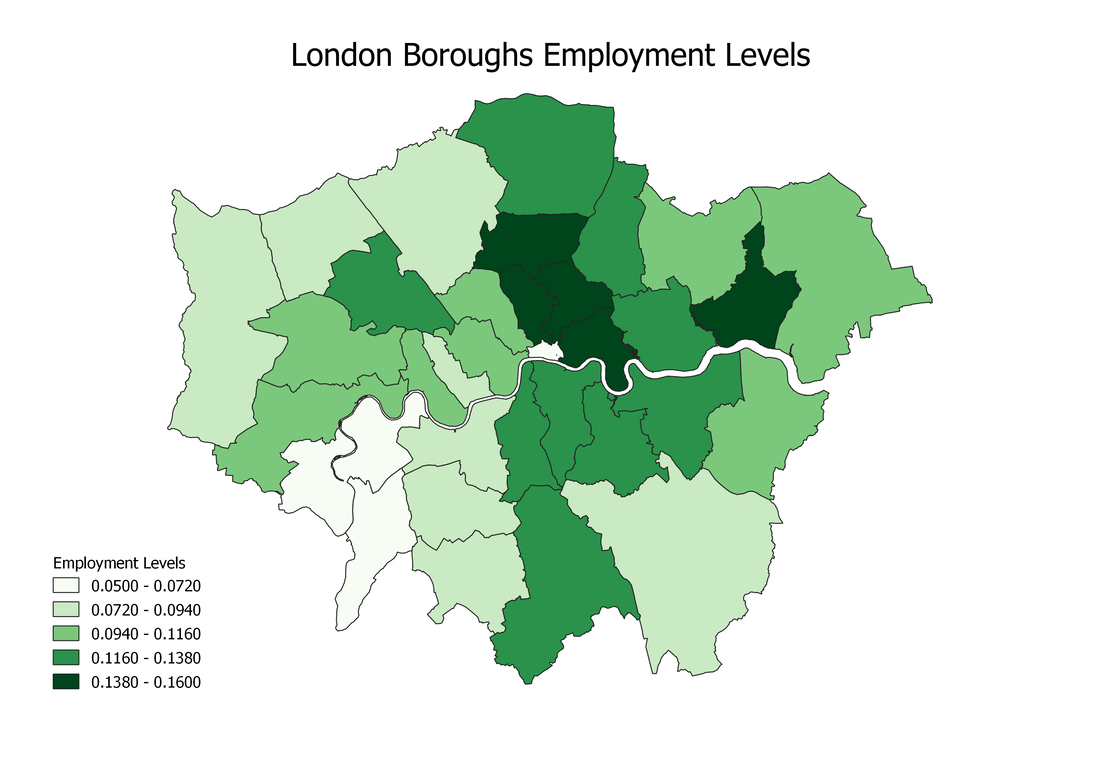
The next map shows employment prospects across London.   
Picture
Employment is greatest in the lighter areas. The darker the colour the less likely for employment prospects.

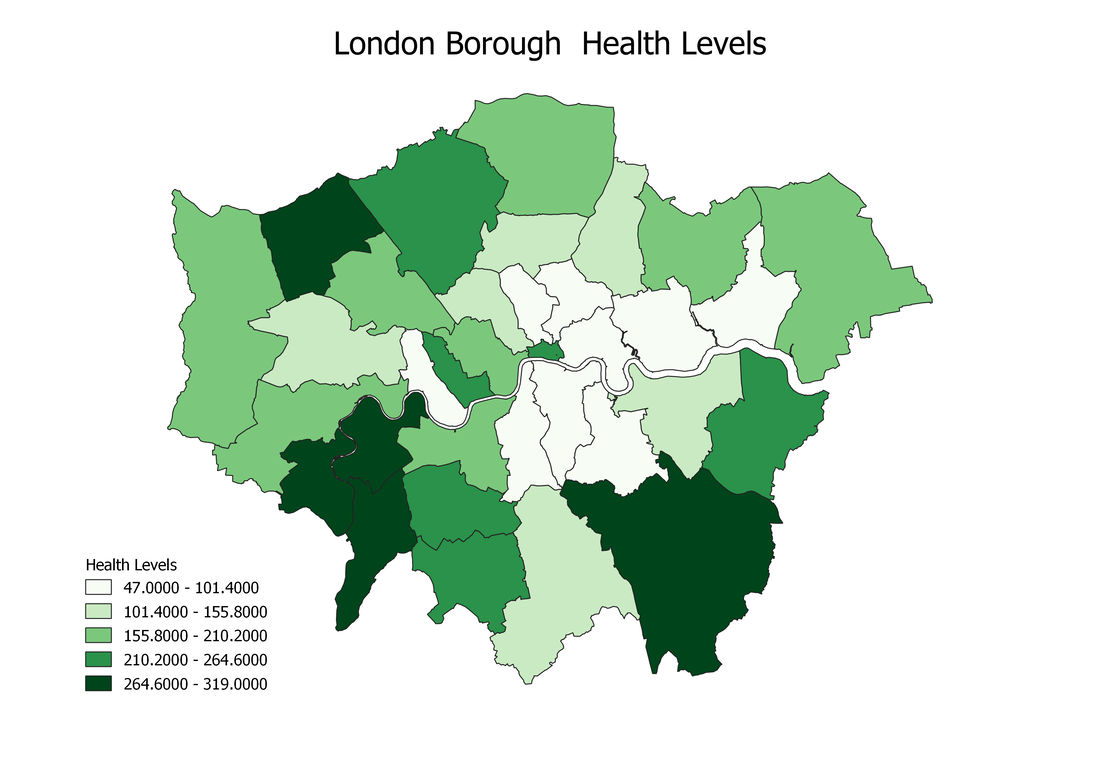
The next map shows health prospects across the London boroughs.
Picture
Here the darker the colour the better your health prospects are.

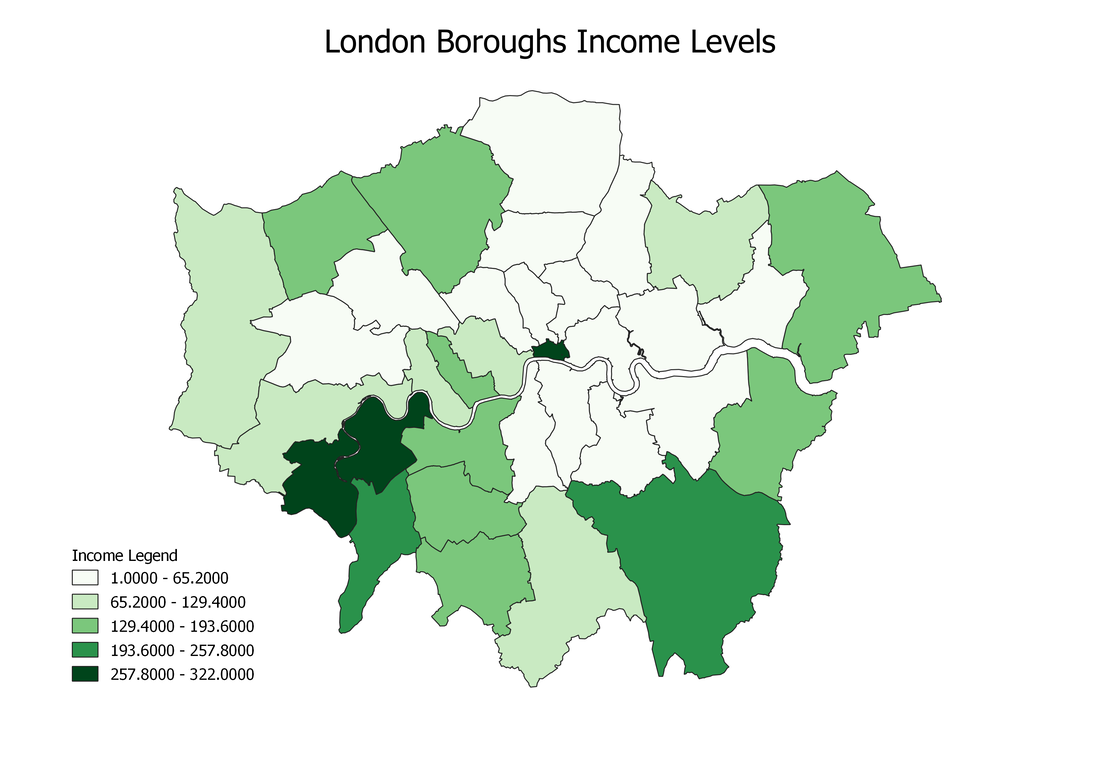
The next map looks at income levels across London. Here the darker the colour the higher the income levels for that borough.

Picture
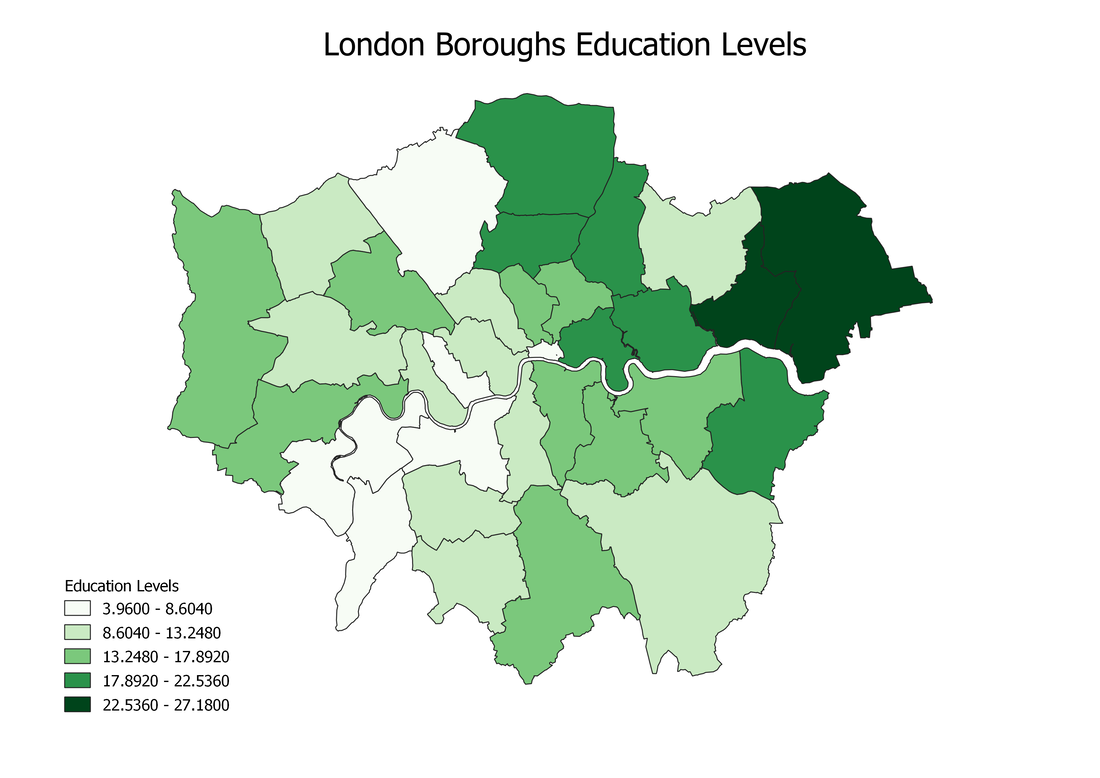
The next map examines educational levels achieved across the London boroughs.
Picture
The darker the colour the lower is the educational achievement.

Looking at these maps should give an indication of which areas of London are most affluent and which are the poorest. However, we can use GIS to confirm which are the most affluent or which are the poorest across the criteria of crime, employment, health, education and income.

​
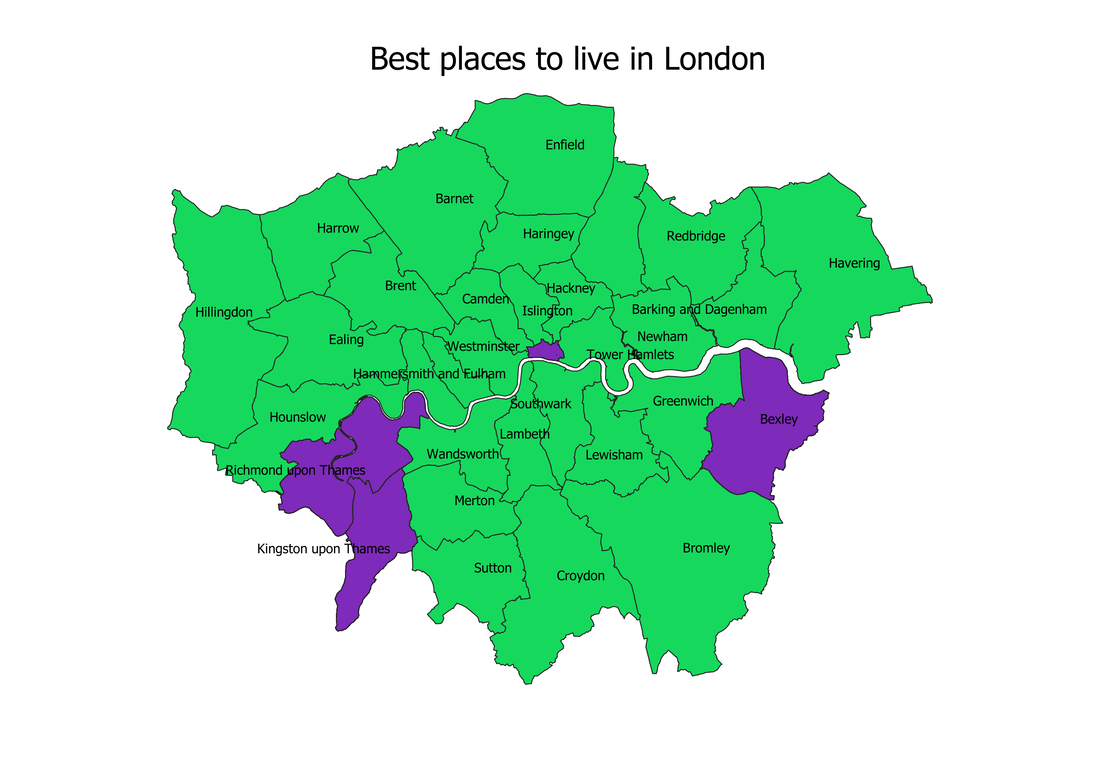
And here is the result of using an SQL statement within a GIS to find the London boroughs with the best average scores on crime, employment, health, education and income levels.
Picture
Out of the 33 London boroughs only three met the criteria and are highlighted on the map above.
0 Comments

Your comment will be posted after it is approved.


Leave a Reply.

    Author

    Joe Short BSc has been involved with various mapping solutions for over twenty years.  If you are considering implementing a GIS  or have ArcGIS Pro, MapInfo Pro or QGIS training requirements, jps services would be happy to be of assistance to your organisation. 

    Archives

    April 2020
    March 2020
    October 2019
    September 2019
    August 2019
    July 2019
    March 2019
    November 2018
    October 2018
    August 2018
    July 2018
    November 2017
    October 2017
    September 2017
    July 2017
    February 2017
    January 2017
    December 2016
    November 2016
    October 2016
    May 2016
    February 2016
    September 2015
    August 2015
    April 2015
    February 2015
    November 2014
    October 2014
    July 2014
    June 2014
    May 2014
    March 2014
    February 2014
    December 2013
    November 2013
    October 2013
    September 2013
    August 2013
    June 2013
    May 2013
    April 2013
    February 2013
    December 2012
    October 2012
    September 2012
    August 2012
    July 2012

    Categories

    All
    Arc Gis
    Arcview
    Autodesk
    Cad
    Gis Training
    Local Government
    Mapbasic
    Mapinfo
    Quantum Gis
    Relational Databases
    Saga Gis

    RSS Feed