If you are familiar with the Atlas feature in QGIS you will be pleased with the new Report feature available in QGIS 3, which is the latest version. With this new Report feature, as well as attribute driven pages, you can also add headers, footers and static pages to your pdf report. In this way your report will become more readable and meaningful to those you send it to.
For instance, with the Atlas function you can iterate through a series of polygons, lines or points to create a map series based upon an attribute field of a specified layer. However, with the Report function, in addition to headers and footers, you can also have nested map series as well as static pages in your final report. Because you can generate a much more complex report with many sub sections, the benefits of headers and footers and their inclusion within the report, to make it meaningful, becomes more apparent.
When you include a nested map series your report will iterate through the attributes and group them based on a linked attribute in the top group layer. If your nested layer does not have an attribute field that can be linked you can create a link with the “Join by location” algorithm from the Tool Box.
For example, if you wanted to link a towns table to a regions table you would use the algorithm to group the towns which are within in regional polygon to create a new table which can then be linked to the top group layer.
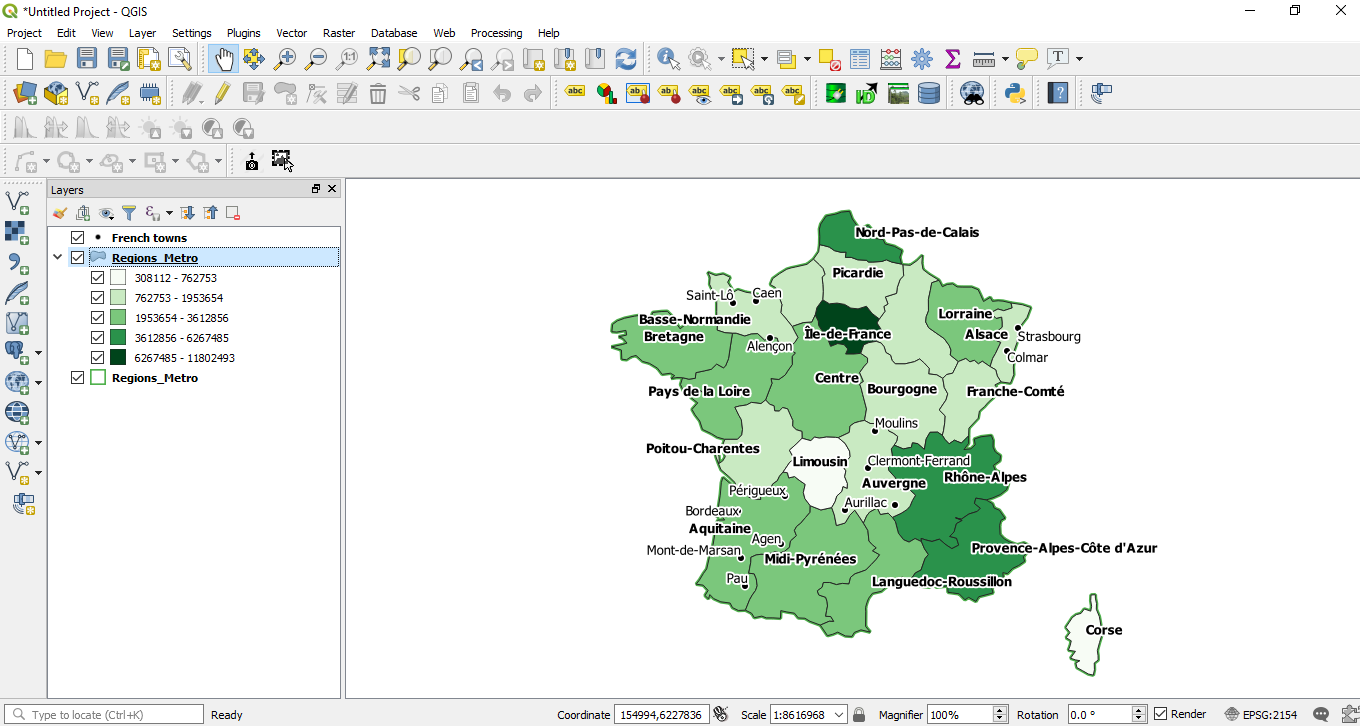
If you start a new project in QGIS 3 you can create a new report quite easily. Below I have created a new project with three layers. A French town’s point layer, a polygon regions layer and a graduated polygon regions layer.
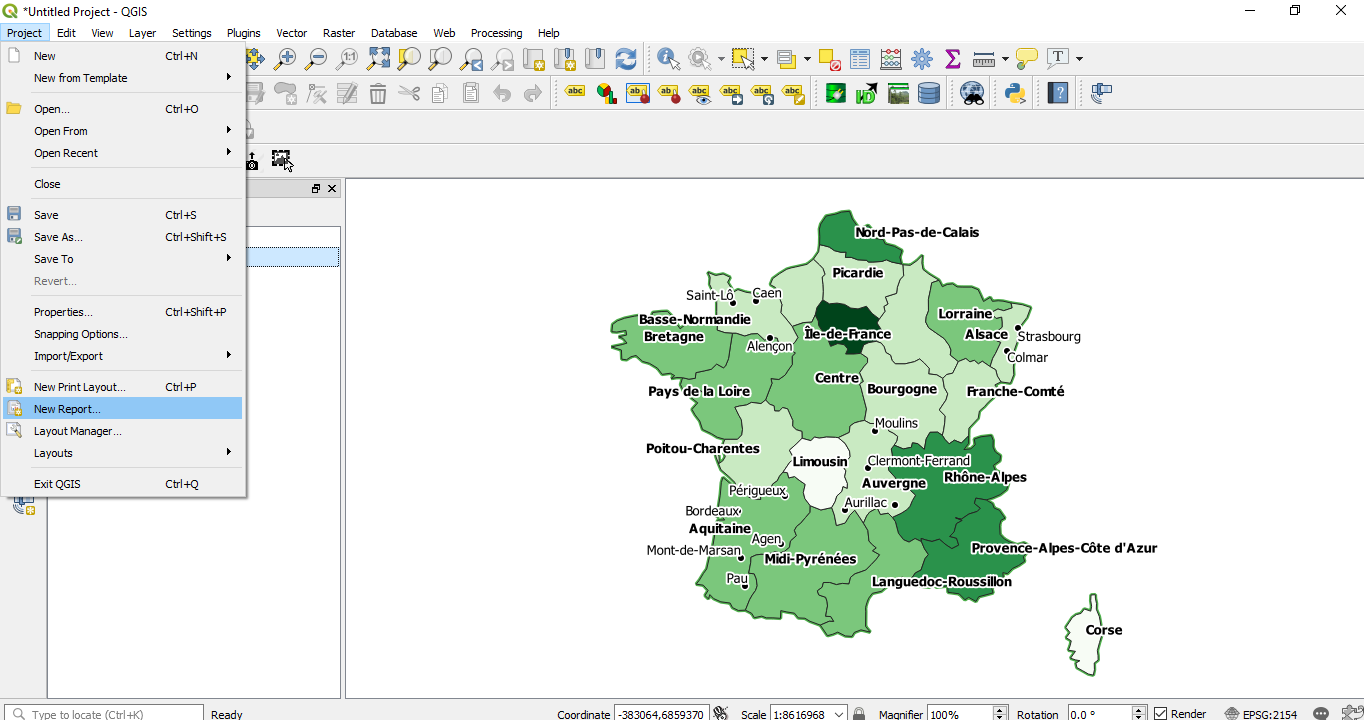
To create a report click on Project on the top menu and select New Report as in the following graphic.
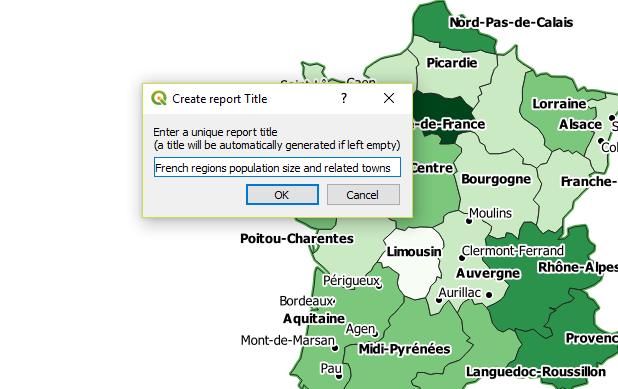
Next complete the Create report Title dialogue box and click OK.
This brings up the Reports dialogue box.
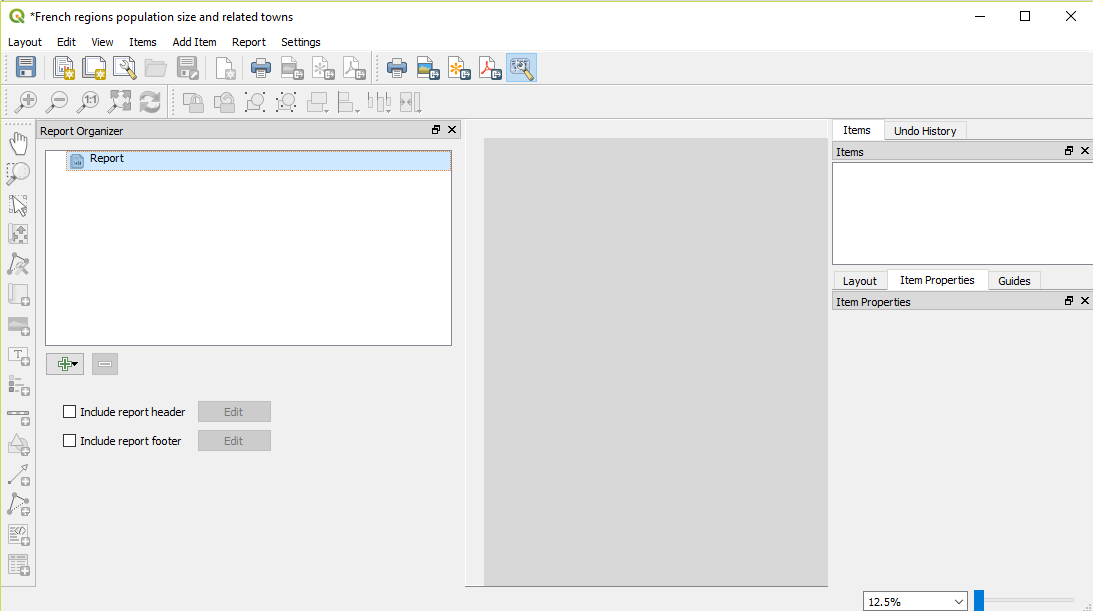
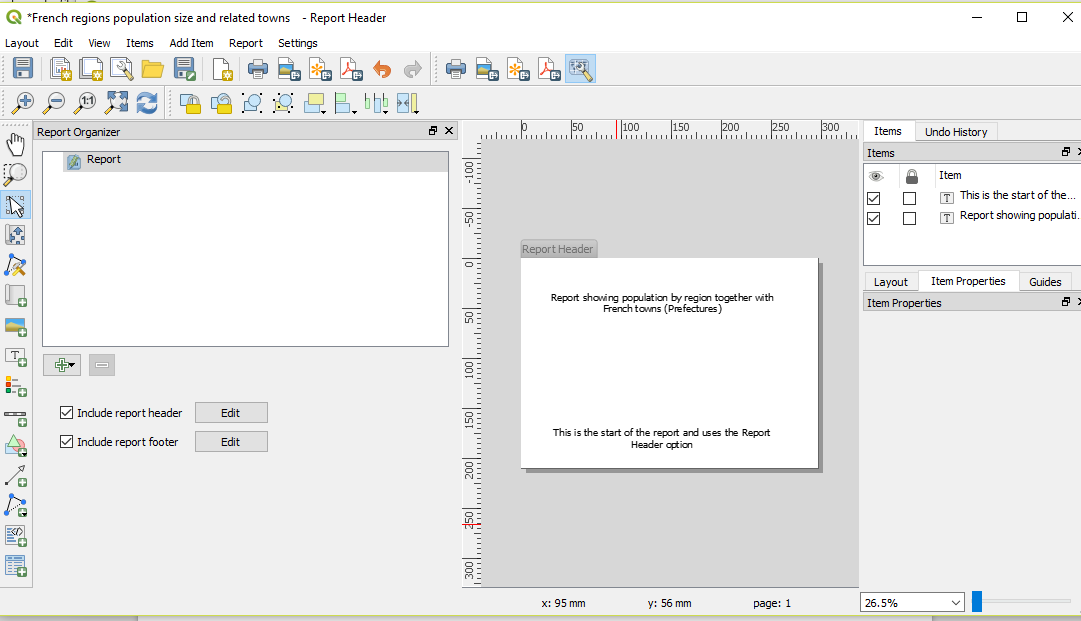
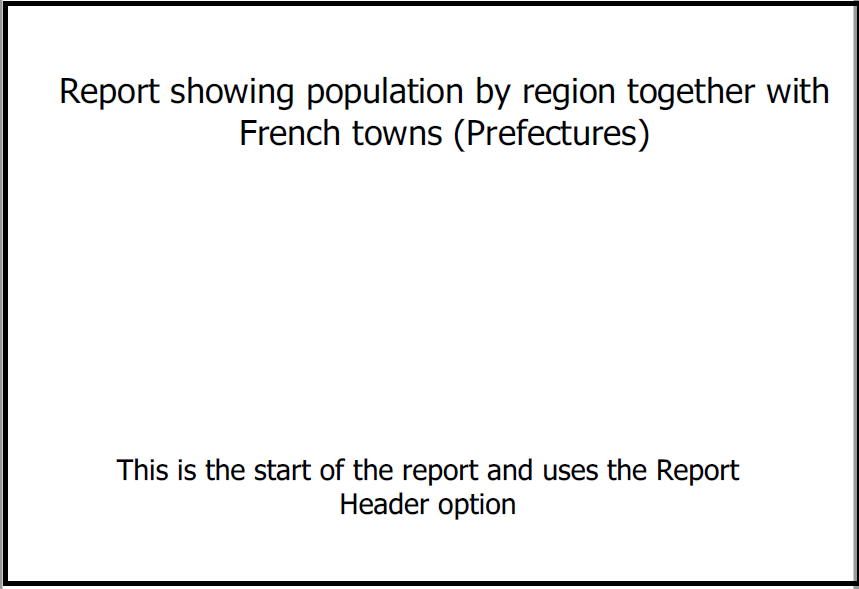
Here you can create both a header and footer for your report. When both header and footer are enabled you can click on the Edit buttons to create the relevant pages for your report. Below is a sample header page containing two text boxes.
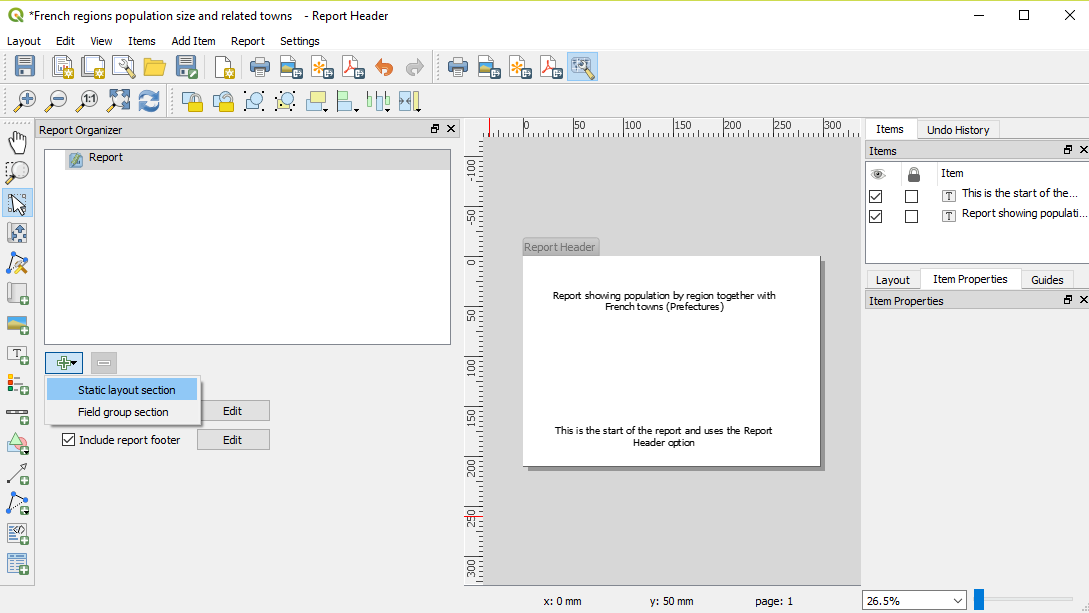
If you want to have a static layout page click on the green plus button. Choose the Static layout section option as in the following screen shot.
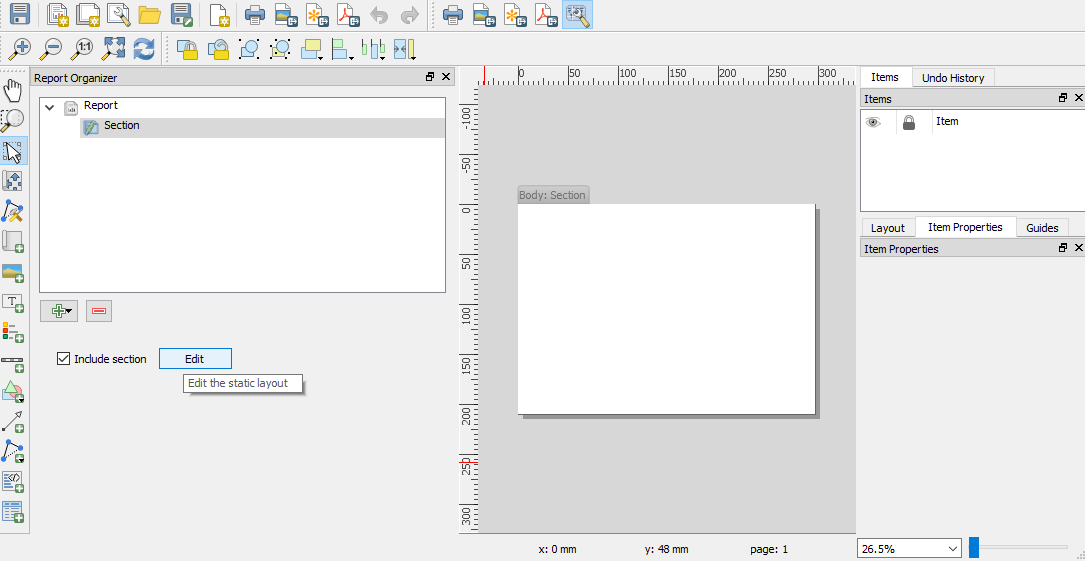
When you click on the Edit button a blank static layout page is created as shown below.
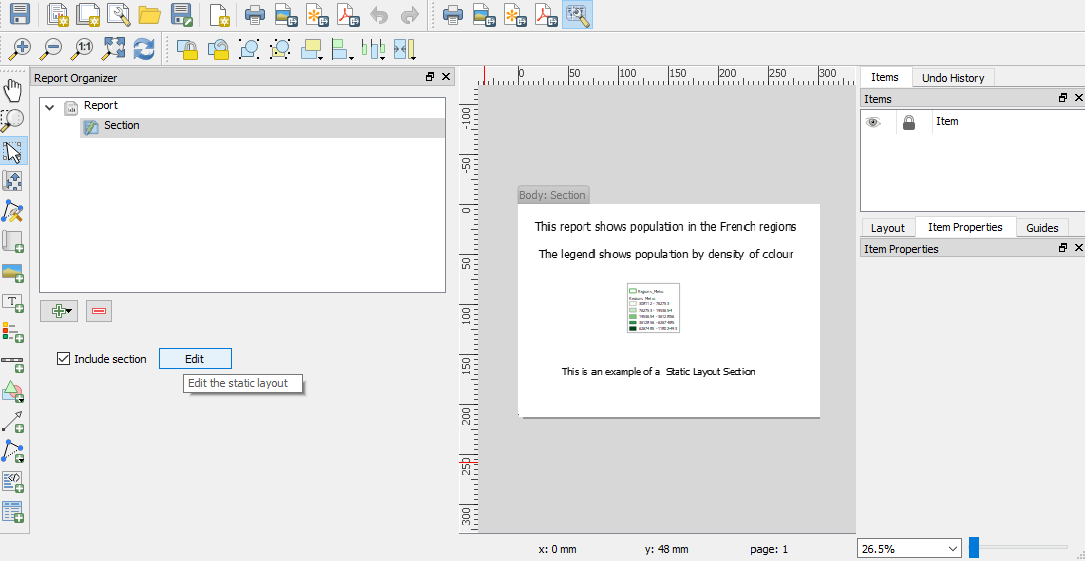
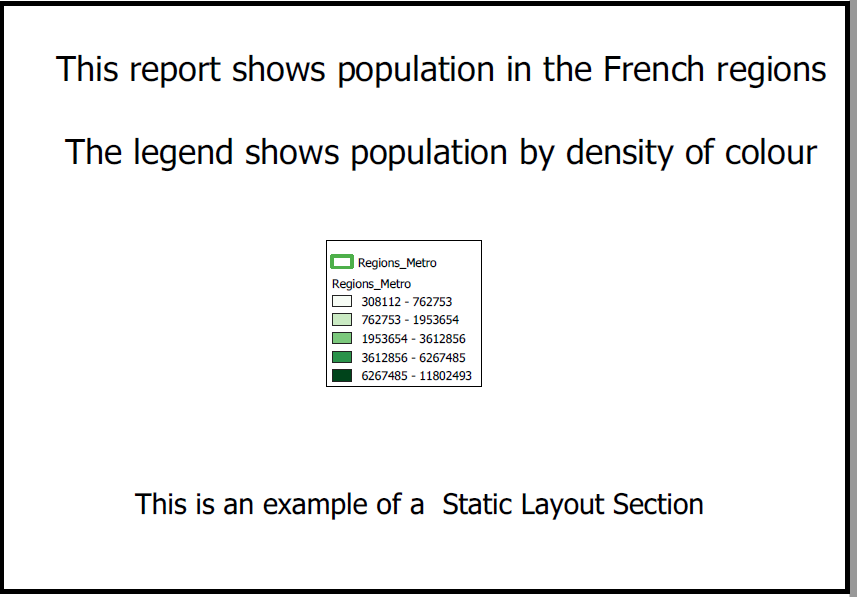
You can include text, images or legends in this section as shown in the following screen shot.
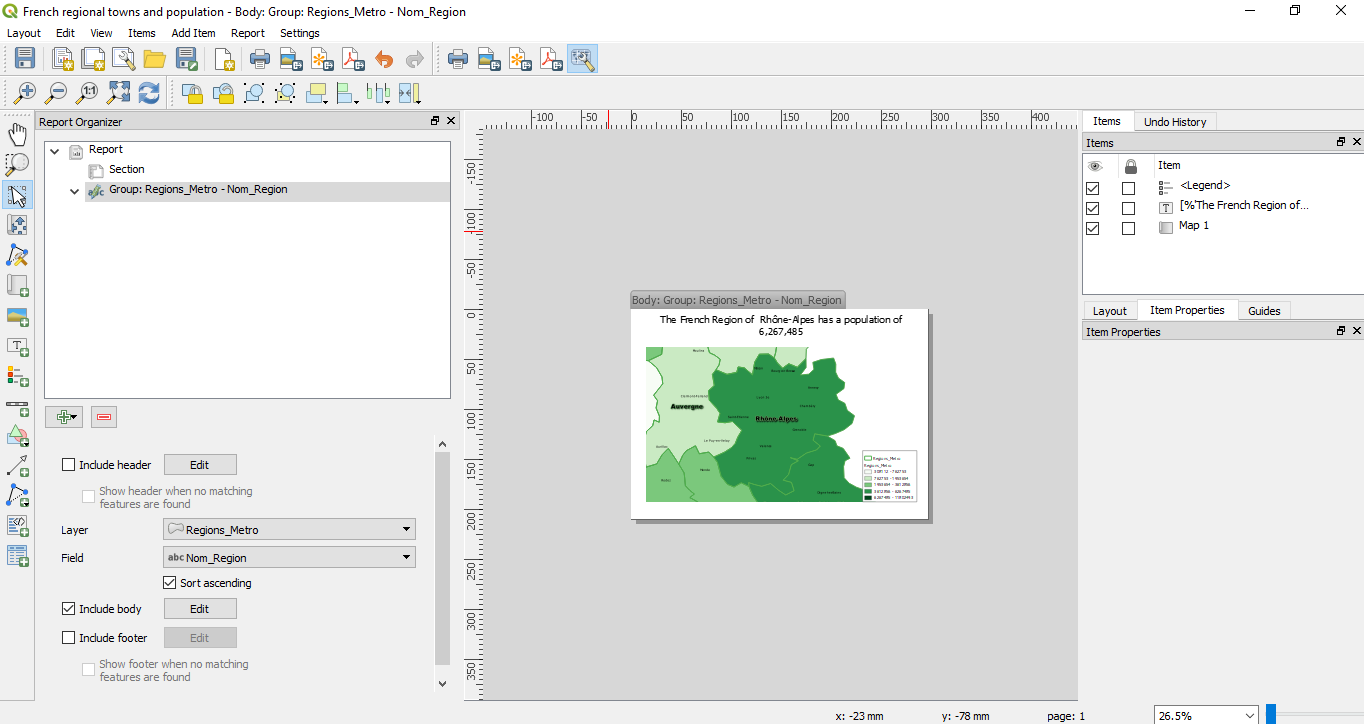
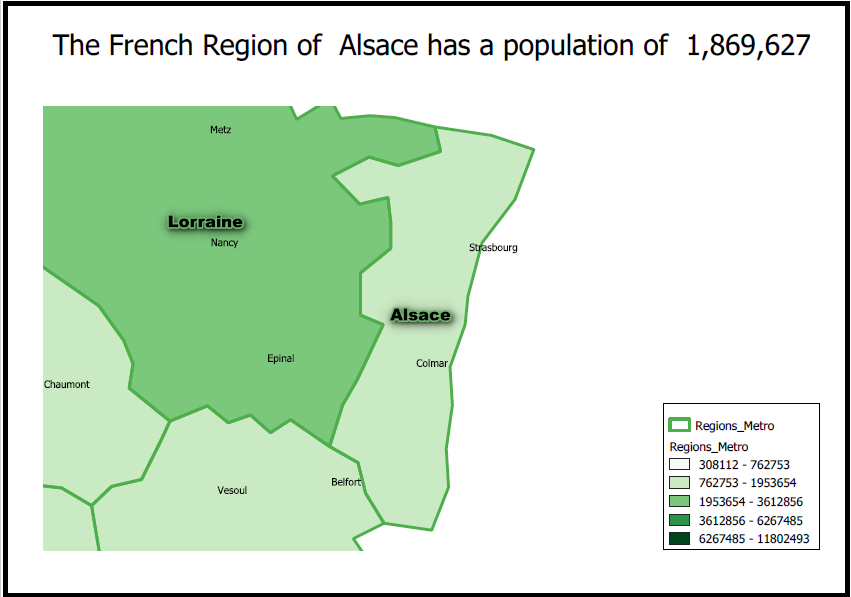
By clicking at the top level on the Report heading and the creating a Field group section we can then edit the Body section. We can create maps related to regional population by including attribute driven text fields together with a map zoomed in to region level and a legend. An example is shown in the next screen shot.
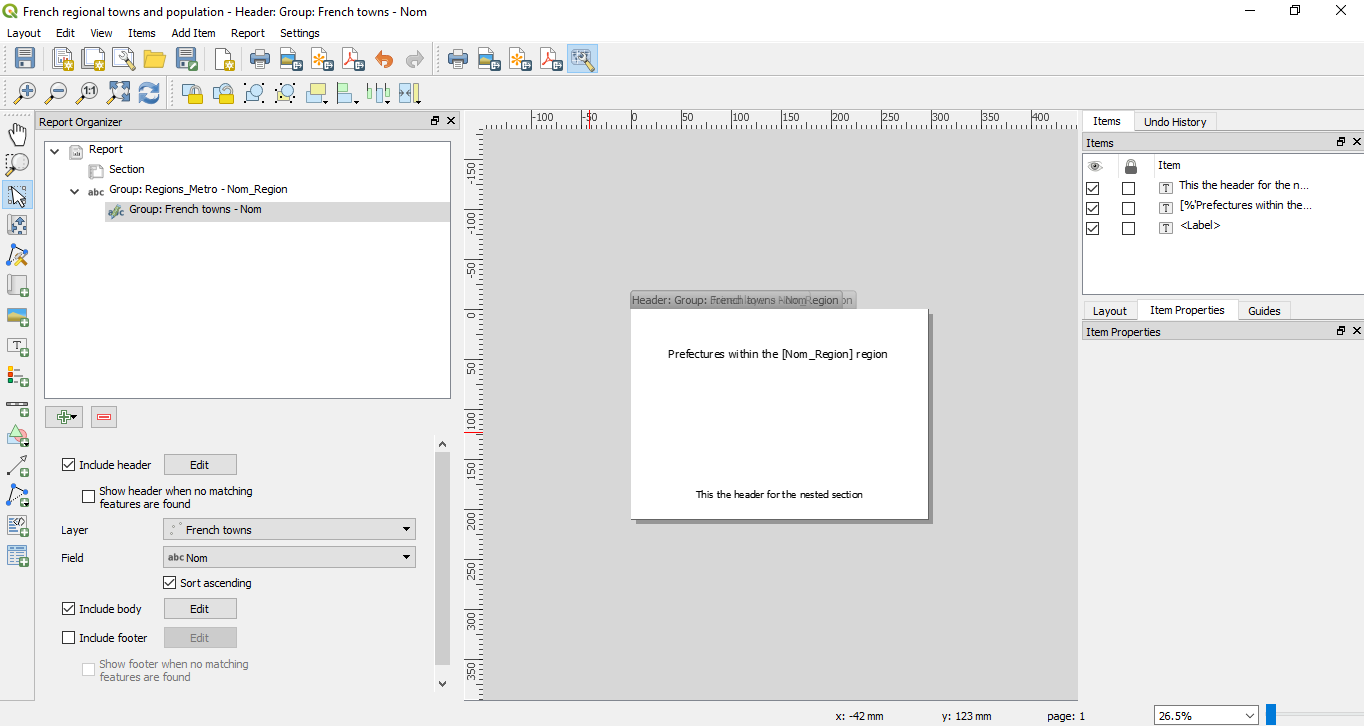
We can now add a nested section by leaving the Group section highlighted rather than going back to the top Report level. This nested section has a header page which is shown below.
Having created a header page related to each set of regional towns we can now create individual maps of each town within a region. You can see from the following screen shot that the map is using an OpenStreet map layer. As this report has both graduated symbol layers and OpenStreet layers ensure that Lock Layers and Lock Styles are enabled within the Items Properties section for each Field group section as shown in the next screen shot.
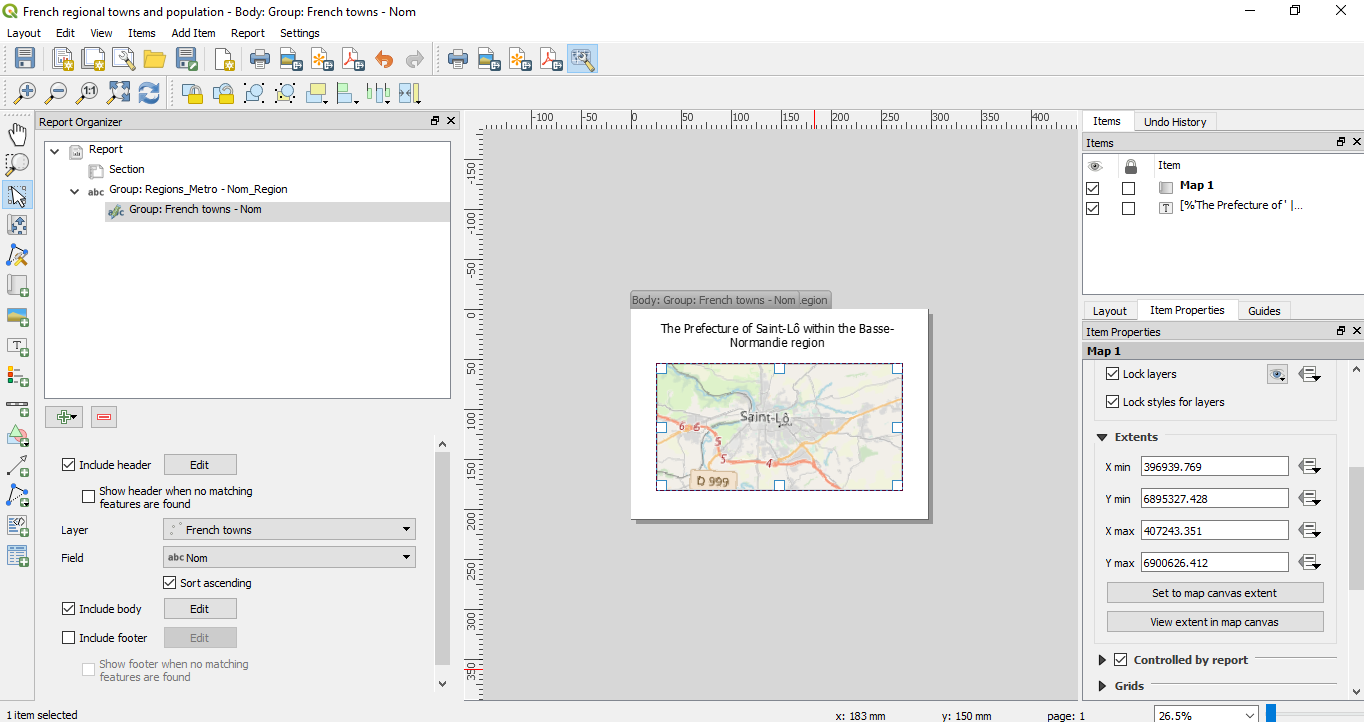
Also note that within each Field group section the maps are controlled by the report so you need to ensure that this option is also enabled.
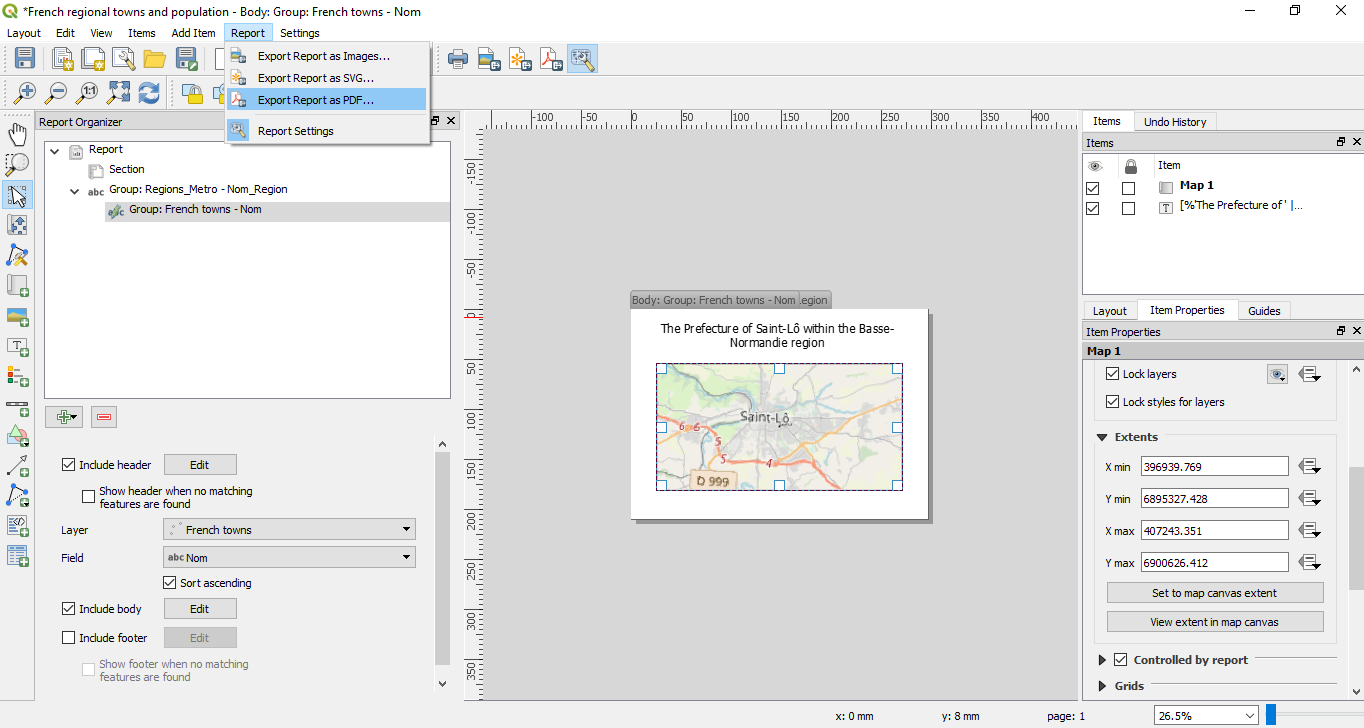
By clicking on the Report option on the top menu you can create a pdf for your report as shown in the next screen shot.
Depending on how many pages are included in your report and whether OpenStreet data is included will determine how long the report takes to be created. Below are some screen shots from the pdf generated by the above report.
Here is the static page screen shot.
Next the report will generate a map for each region of the French map as shown in the next screen shot.
Next the nested header page is printed as in the next screen shot.
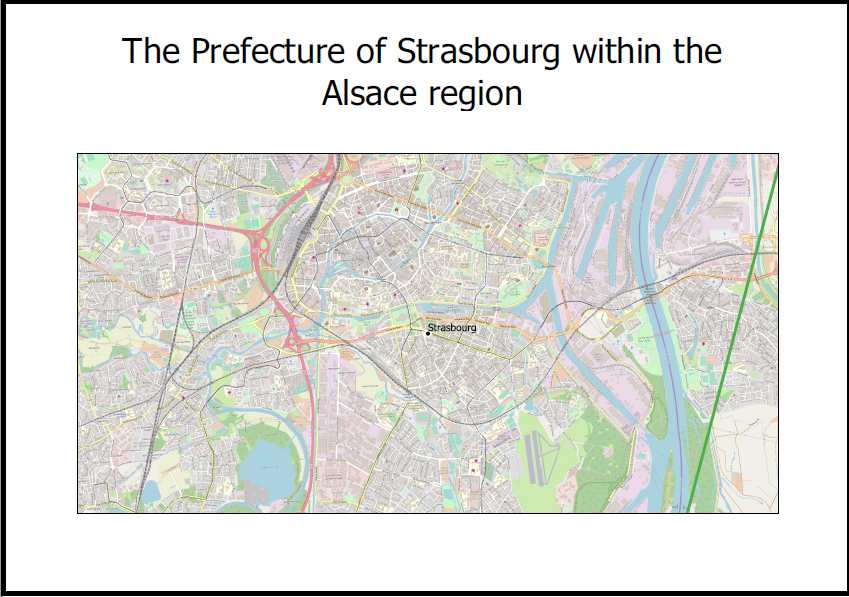
Next the report will produce maps of the individual towns within the Alsace region as shown in the next screen shot.
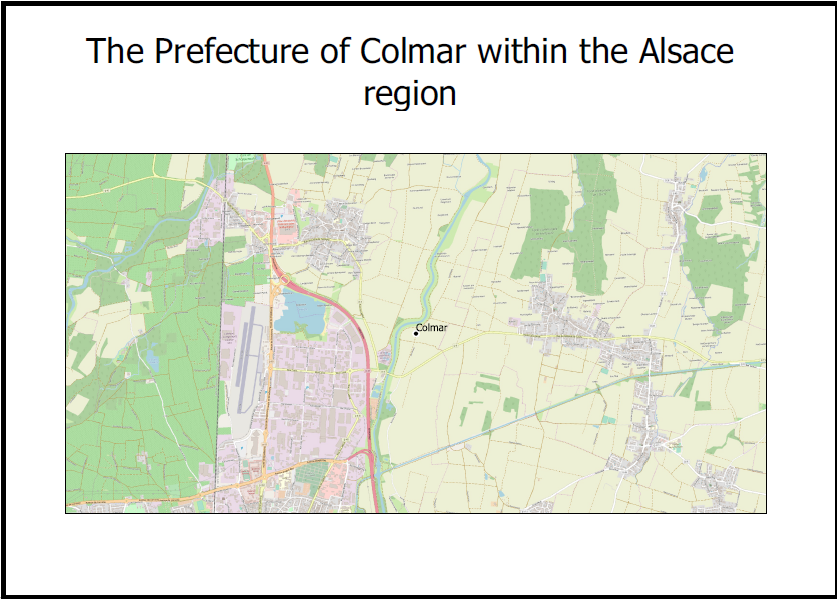
Note that the nested Prefecture sections show an OpenStreet layer whilst the Regional sections show a graduated symbol layer.
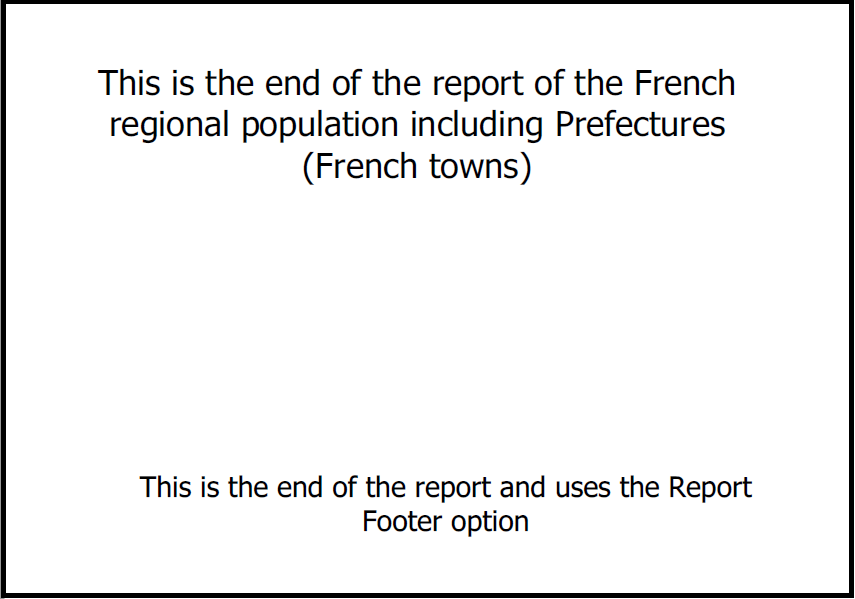
This final screen shot shows the final page of the report.
As the above example shows the new Report feature has potential to produce both simple and complex reports which can contain a range of map formats. Because of its flexibility it represents a considerable improvement over the previous Atlas program.
 RSS Feed