Each feature within a GIS has appropriate attribute data attached to it. This data can contain information such as, in the case of a city, its name, size of population and other relevant details.
All GIS store data in a format which is commonly referred to as an attribute table. Each layer contains an attribute table which is similar to a spreadsheet layout. Within this table the user can put as much or as little information as is required for the layer’s requirements. Like a spreadsheet the data is stored in a series of rows and columns. Each row represents a single record and each column represents a field within the table. Some tables only contain a few fields with a limited number of columns, whilst other tables, say containing crime statistics, can have thousands of records and numerous fields.
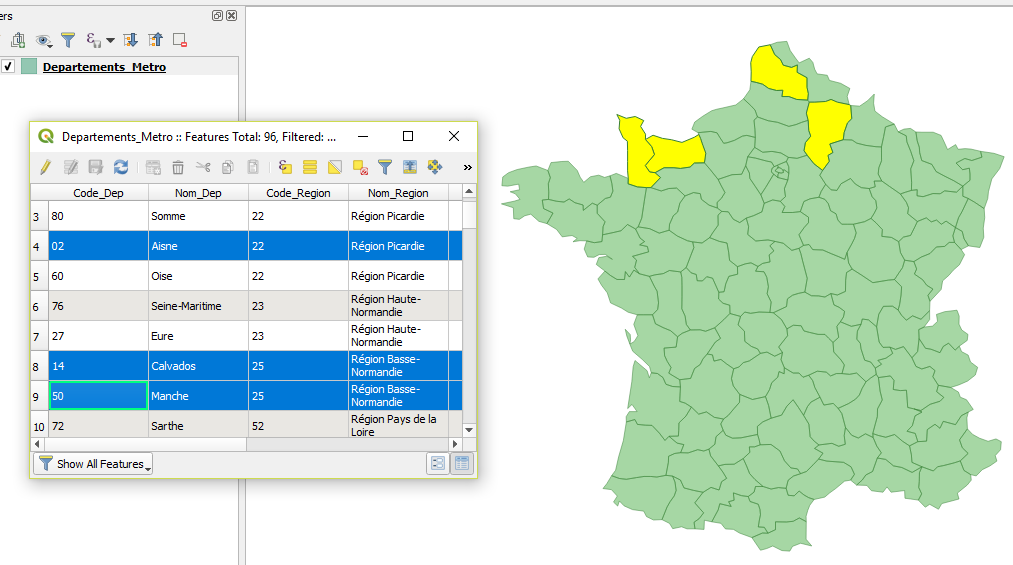
Information within the attribute table is linked to the point, line or polygon within the map layer. Clicking on one or more features in the map layer will also highlight the same features in the attribute table if this has been made visible. Similarly, clicking on one or more rows in the attribute table will highlight these features in the map layer.
All GIS store data in a format which is commonly referred to as an attribute table. Each layer contains an attribute table which is similar to a spreadsheet layout. Within this table the user can put as much or as little information as is required for the layer’s requirements. Like a spreadsheet the data is stored in a series of rows and columns. Each row represents a single record and each column represents a field within the table. Some tables only contain a few fields with a limited number of columns, whilst other tables, say containing crime statistics, can have thousands of records and numerous fields.
Information within the attribute table is linked to the point, line or polygon within the map layer. Clicking on one or more features in the map layer will also highlight the same features in the attribute table if this has been made visible. Similarly, clicking on one or more rows in the attribute table will highlight these features in the map layer.
The fact that the map layer and the attribute table are linked enables us to be able to ask questions about the data contained within the table and show the results on the map layer. We could query our data to find, for example, the largest cities or the number of airports within a region or where the population is over a certain level. In fact, the modern GIS enables us to ask an almost unlimited number of questions about the data contained within the layers of the map.
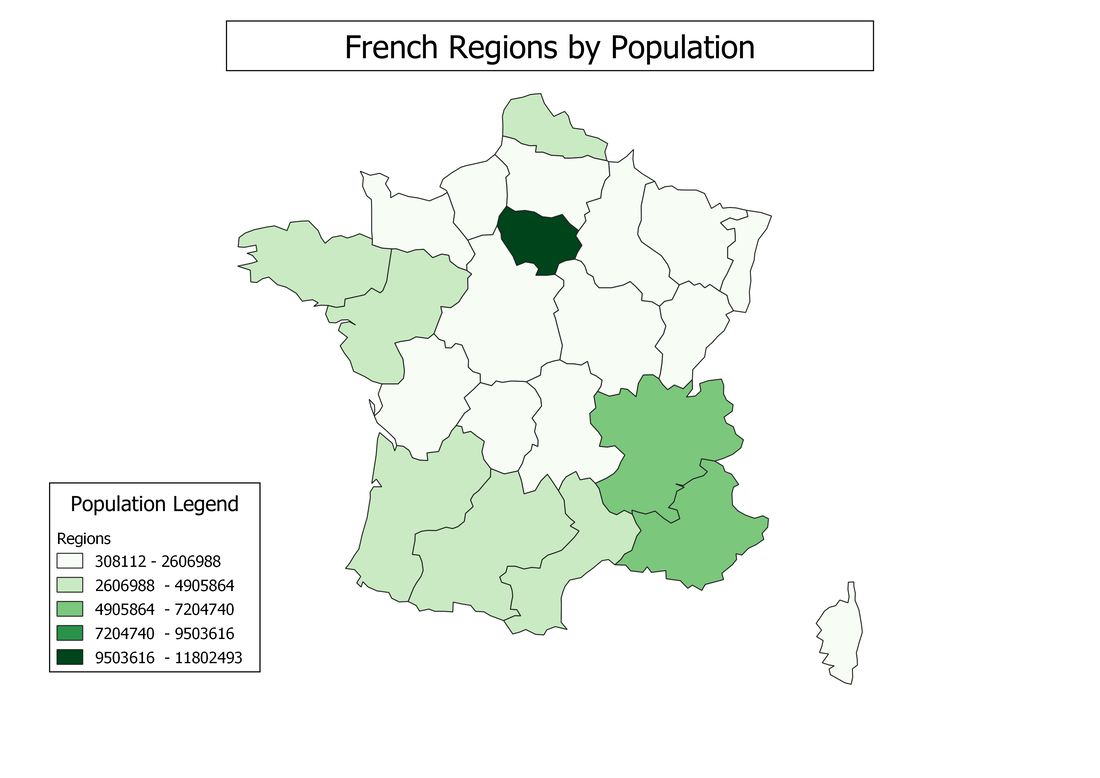
As well as being able to highlight features on our map layer we also have the ability to create thematic maps based on the data within the attribute table. Sometimes, it is easier to understand the underlying data within the layer when we create a thematic representation of that information. For instance, population by region can be easily be shown by using a thematic representation.
As well as being able to highlight features on our map layer we also have the ability to create thematic maps based on the data within the attribute table. Sometimes, it is easier to understand the underlying data within the layer when we create a thematic representation of that information. For instance, population by region can be easily be shown by using a thematic representation.
As well as being able to ask questions about data within a single layer it also possible to create a query which covers multiple layers. To do this we can use the SQL feature, which stands for standard query language, available within the GIS.
Some GIS software such as MapInfo Pro and ArcGIS Pro have always had features to enable users to create quite sophisticated queries from layers within their proprietary software. Until recently, QGIS, which is open source, was not able to match this level of sophistication. Now however QGIS has a feature which can enable users to create sophisticated queries using the virtual layer facility.
Desktop GIS now has many features which enable the most complex questions to be asked about the layers within a project. The visual results of such queries can often give a greater insight than the equivalent spreadsheet bar or pie chart can achieve.
 RSS Feed