jps services
  • Home Page
  • GIS Training Courses
    • QGIS Training Courses
    • ArcGIS Training Courses
    • MapInfo Pro Training Courses >
      • MapBasic Training Course
  • About
  • Blog

Using labeling features in your maps

3/3/2014

1 Comment

 
If you want to label your map you can normally achieve this without too much difficulty with GIS software such as ArcGIS, MapInfo or QGIS. All of these desktop GIS provide the facility to automatically place labels on the map by using data in the attribute table linked to a layer. 
Various labeling functionality is available depending on your choice of GIS software. However, most desktop GIS now offer dynamic labeling options regarding text style, buffers, shadows and placement. Below is an example created with QGIS of a regional map of France showing most of these options.
Regional Map of France
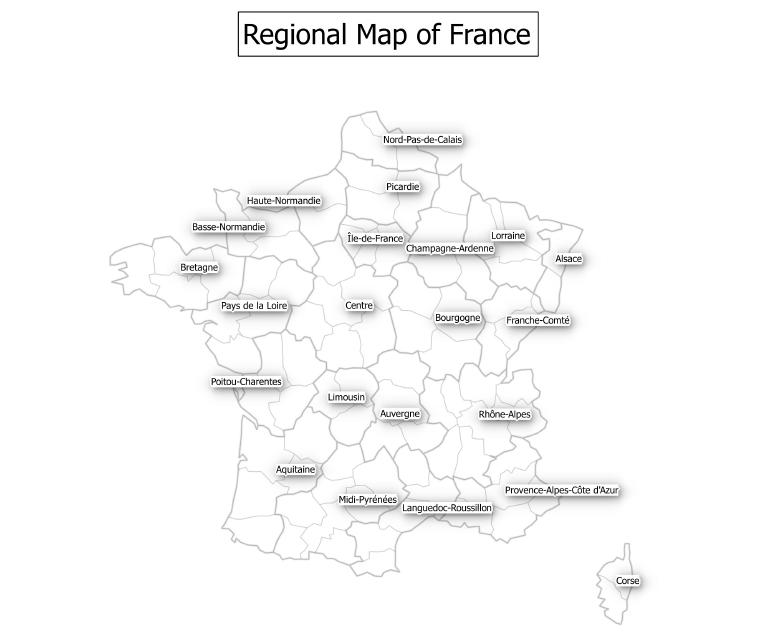
Automatic labeling from data in the attribute table
Using the label facility rather than adding a text field is recommended as labels and text behave differently. Labels will remain near to the features they are associated with when you zoom in and out. By contrast, text does not react this way when you use zoom or pan controls in your map.   

Read More
1 Comment

Rendering a layer with rule based symbology

1/3/2014

0 Comments

 
Some desktop GIS now support ruled based symbology as a method of rendering a vector layer. If your GIS supports this option you can convert a vector layer from simple points, lines and polygons into something much more meaningful.
Here is an Ordnance Survey sample prior to applying the rule based option. As you can see the layer shows a plain black and white polygon map without any of the features being differentiated depending upon their underlying layer attribute data.  
Ordnance Survey Sample Courtesy of Ordnance Survey
Ordnance Survey sample map. (Copyright OS)

Read More
0 Comments

Standard methods of feature classification  

28/2/2014

0 Comments

 
Desktop GIS software such as ArcGIS, MapInfo and QGIS offer a number of classification methods. The most commonly featured are Natural Breaks (Jenks), Equal Interval, Quantile, Standard Deviation and Manual.
Natural Breaks was developed by George Jenks. This method uses clusters and gaps in the data to create classes.
Natural Breaks (Jenks)

Read More
0 Comments

Applying symbology to maps

20/2/2014

0 Comments

 
When you first load a vector layer into your map it will be assigned a default colour. For instance, if you have a outline map of the UK, in a vector polygon format, it will load with a different colour each time you bring it into your map. Vector maps are built up from a combination of point, line and polygon layers. QGIS and ArcGIS only allow a layer to contain either point, line or polygon objects. MapInfo is different in that it will allow vector data for more than one object type to be present within the same layer. You can still import a MapInfo tab file, containing a layer with more than just one object type present, directly into QGIS. QGIS will check to see if more than one object type is present within the MapInfo layer and will then separate the various object types into separate point, line and polygon layers.

Read More
0 Comments

GIS Training: The differences and similarities of popular GIS browsers

19/2/2014

0 Comments

 
Whilst GIS browser facilities, which are now available for ArcGIS, MapInfo and QGIS, have similar functionality they also have a few differentiating features. These features reflect basic differences in how these different GIS software solutions operate.

For instance, ArcGIS has what is known as a data view. In the data view you have the map display together with a table of contents. ArcGIS can support multiple data views within the map display. However only one data view can be active at a time. As well as data views there is also a separate layout view. In the layout view you can see your map as it would appear prior to being sent to a printer. Unlike the data view you can have multiple data view frames visible within the layout view. With ArcCatalog, the ArcGIS browser, you can drag vector and raster layer information into either your data view or your layout view. When you drag a vector layer into a data or layout view it will initially be assigned a random colour. You can of course modify the layer once you have loaded it.  

Read More
0 Comments

GIS Training: Map navigation

15/2/2014

0 Comments

 
If you want to examine a specific area of your map you have a selection of tools to help you. You can activate the Zoom in tool which is usually represented as a magnifying glass containing a plus sign. By clicking on the map the Zoom in tool will increase magnification, usually by two or three times, based on the settings within your GIS software. Alternatively you can create a box with the help of your mouse to zoom in to an area of interest. Depending again on your settings, the layer may show label information if this layer has been set up to be scale dependent. For instance, these settings are usually found within the Layers Properties dialogue box. Here you can decide whether labels display based upon a preset scale. This ensures that your map does not look too cluttered when you zoom out. Once you have zoomed into an area of interest you can use the Pan tool to move about this area of your map. There is also the option of a Zoom and Pan tool in some GIS software packages. This tool enables you to have the combined functionality to either Zoom in or out and Pan whilst using this specific option.

Read More
0 Comments

GIS Training: An overview of desktop GIS  

13/2/2014

0 Comments

 
A desktop GIS is an application for showing maps and interrogating them. Through analysis of maps you are able to answer a variety of questions of a geographical nature. With a desktop GIS you create maps which give answers pertinent to what is being investigated.
Modern GIS solutions provide a map window for viewing your spatial data. Most will automatically provide a table of contents listing the layers being displayed in the map. Manipulation of the map data is achieved through menus, toolbars and dialogue boxes. Many GIS solutions are customisable so that only the features which you commonly use are displayed. With the latest versions of Windows various toolbars and dialogue boxes can be automatically docked to suit your requirements. Both MapInfo and ArcGIS can use these latest Windows facilities when docking, pinning, displaying and hiding dialogue boxes. Any Windows based solution can also have toolbars either docked or floating to suit individual requirements. Again, most GIS solutions will also save your preferences when you close the software. On opening again these same settings will then be restored rather than the default.

Read More
0 Comments

GIS Training:  Asking questions about spatial relationships

12/2/2014

0 Comments

 
With the attribute data associated with a layer within your map  it is possible to ask many questions and have them answered. This can be achieved through the functionality available within desktop GIS. These questions could include relationships between features, also known as objects, within the map layers.  

Read More
0 Comments

GIS Training: Displaying features and using attribute data

11/2/2014

0 Comments

 
With a paper map you can only view the information that is present on the map at the scale provided. You could take a closer look if you use a magnifying glass if you wanted to look at a specific detail. But apart from that if you wanted additional information you would have to look at more detailed maps of the area of interest.

Read More
0 Comments

An introduction to GIS training

10/2/2014

0 Comments

 
Prior to the introduction of computer technology the world was explored with the help of hand crafted maps and globes. Within a fairly short period of time, less than forty years, computers have enabled us to better understand our world through the medium of geographical information systems. These systems were initially the province of government departments and very large organisations who could afford mainframe computer systems. Over time, computing power has increased whilst computers have become smaller and more financially viable for even the smallest organisation.   

Read More
0 Comments
<<Previous

    Author

    Joe Short BSc has been involved with various mapping solutions for over twenty years.  If you are considering implementing a GIS  or have ArcGIS Pro, MapInfo Pro or QGIS training requirements, jps services would be happy to be of assistance to your organisation. 

    Archives

    April 2020
    March 2020
    October 2019
    September 2019
    August 2019
    July 2019
    March 2019
    November 2018
    October 2018
    August 2018
    July 2018
    November 2017
    October 2017
    September 2017
    July 2017
    February 2017
    January 2017
    December 2016
    November 2016
    October 2016
    May 2016
    February 2016
    September 2015
    August 2015
    April 2015
    February 2015
    November 2014
    October 2014
    July 2014
    June 2014
    May 2014
    March 2014
    February 2014
    December 2013
    November 2013
    October 2013
    September 2013
    August 2013
    June 2013
    May 2013
    April 2013
    February 2013
    December 2012
    October 2012
    September 2012
    August 2012
    July 2012

    Categories

    All
    Arc Gis
    Arcview
    Autodesk
    Cad
    Gis Training
    Local Government
    Mapbasic
    Mapinfo
    Quantum Gis
    Relational Databases
    Saga Gis

    RSS Feed