The basic concepts of desktop GIS software haven’t really changed very much since their inception with MapInfo Pro software some thirty years ago. The original designers of desktop mapping software wanted to use the new Windows operating system to emulate the functionality only previously available with the help of skilled cartographers.
The concept these early designers wanted was to emulate paper map creation but in a digital format. One of the main ways they achieved this was by using a process whereby each element of the map could be built up through creating a series of layers prior to printing the final output. Features which we now take for granted such as zooming and panning where at that stage innovative and novel to new users of GIS software.
If we look at a screen shot from QGIS we can see that the map area is displaying a map of Mexico. On the Layers panel on the left side there are five separate layers shown. Each layer represents data in either a point, line or polygon format. All of these layers are in a vector data format.
Vector data could be defined as a list of values. For example, a point has a pair of x and y co-ordinates, a line has two pairs of x and y co-ordinates and a polygon has points where the first and last co-ordinates are joined to create an enclosure.
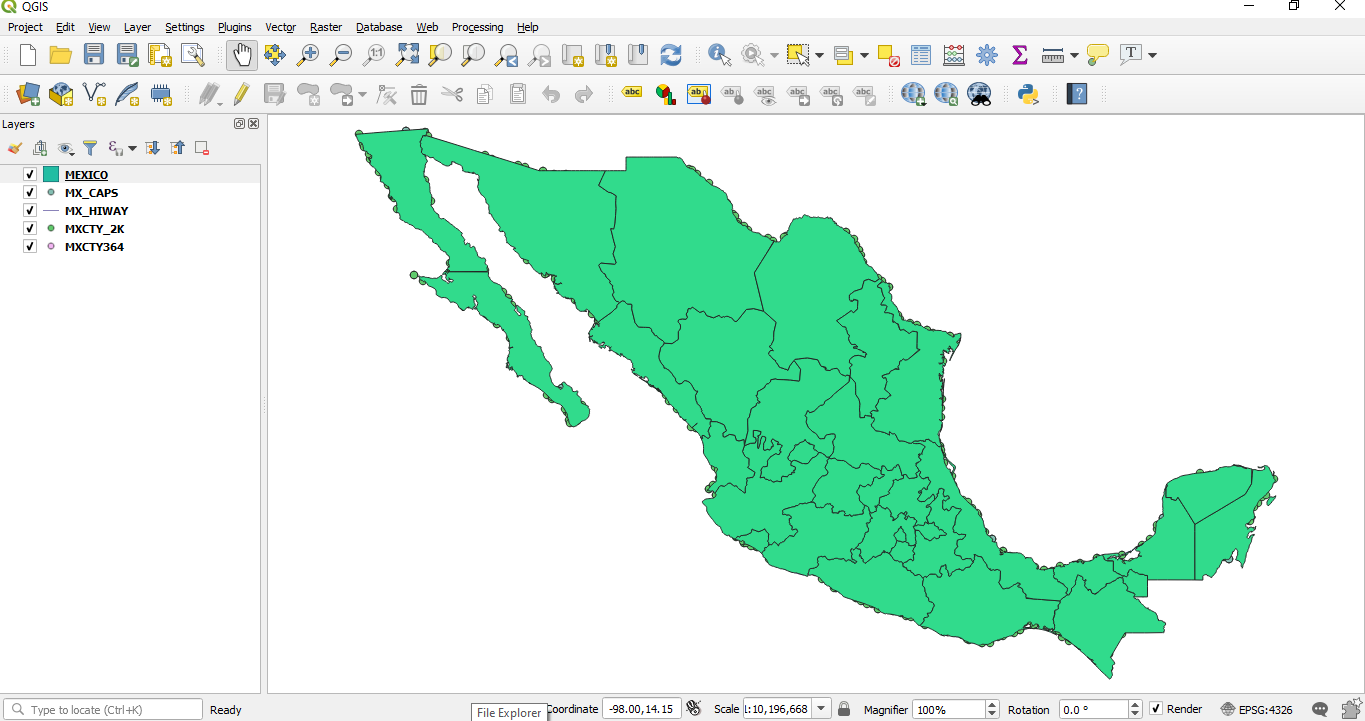
The layers have been brought into QGIS as individual layers which means they will display in a random colour. If these layers had been brought in as a project file each layers’ defined colour scheme would have been preserved.
The next thing to note is that although we have five layers only one layer is currently displaying. This is because top polygon MEXICO layer is hiding the features of the other layers. Again, if this had been loaded as a project file the correct layer order would have been preserved.
Clicking on the MEXICO layer and moving it as shown in the next screen shot will reveal the other layers’ details.
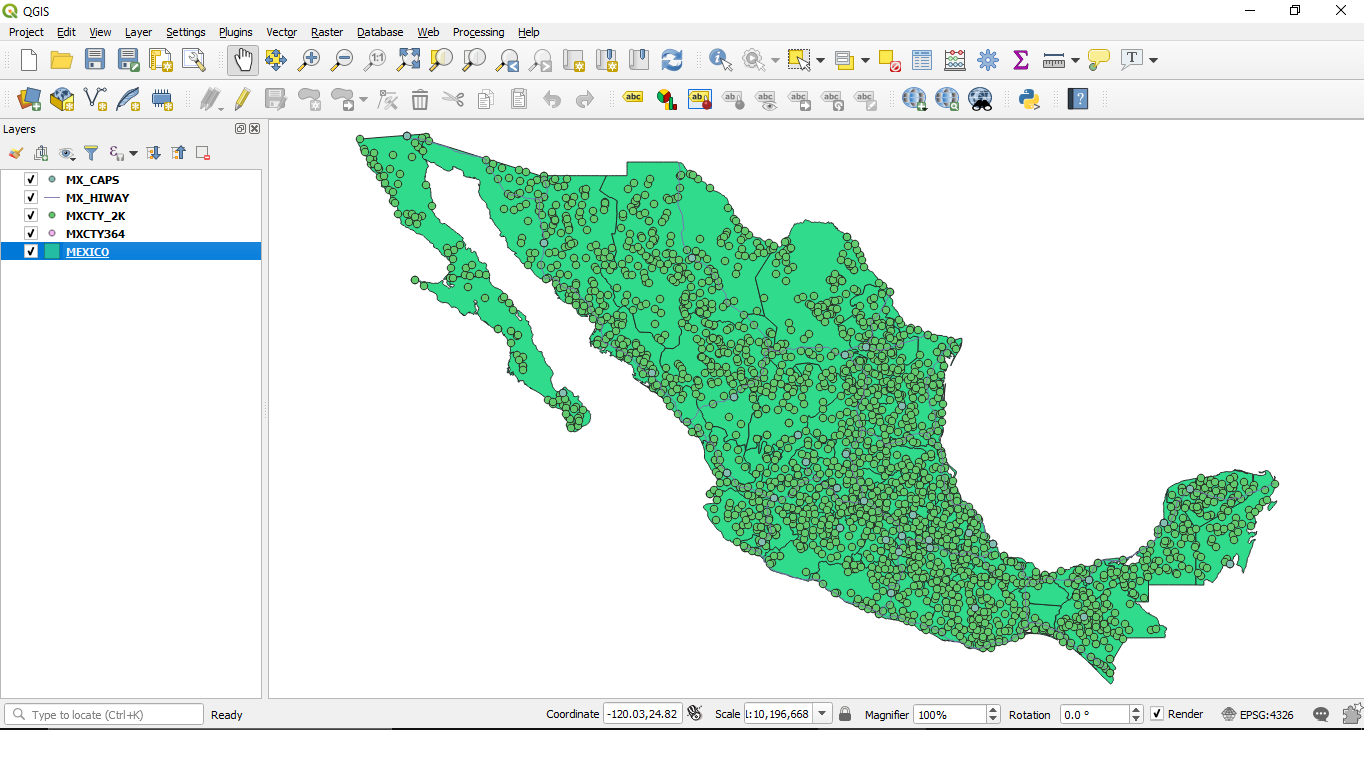
Now we can see that some layers are still not displaying correctly because they are being hidden by layer MXCTY_2K. Two options are now available. Firstly, we could turn off this layer as shown in the next screen shot.
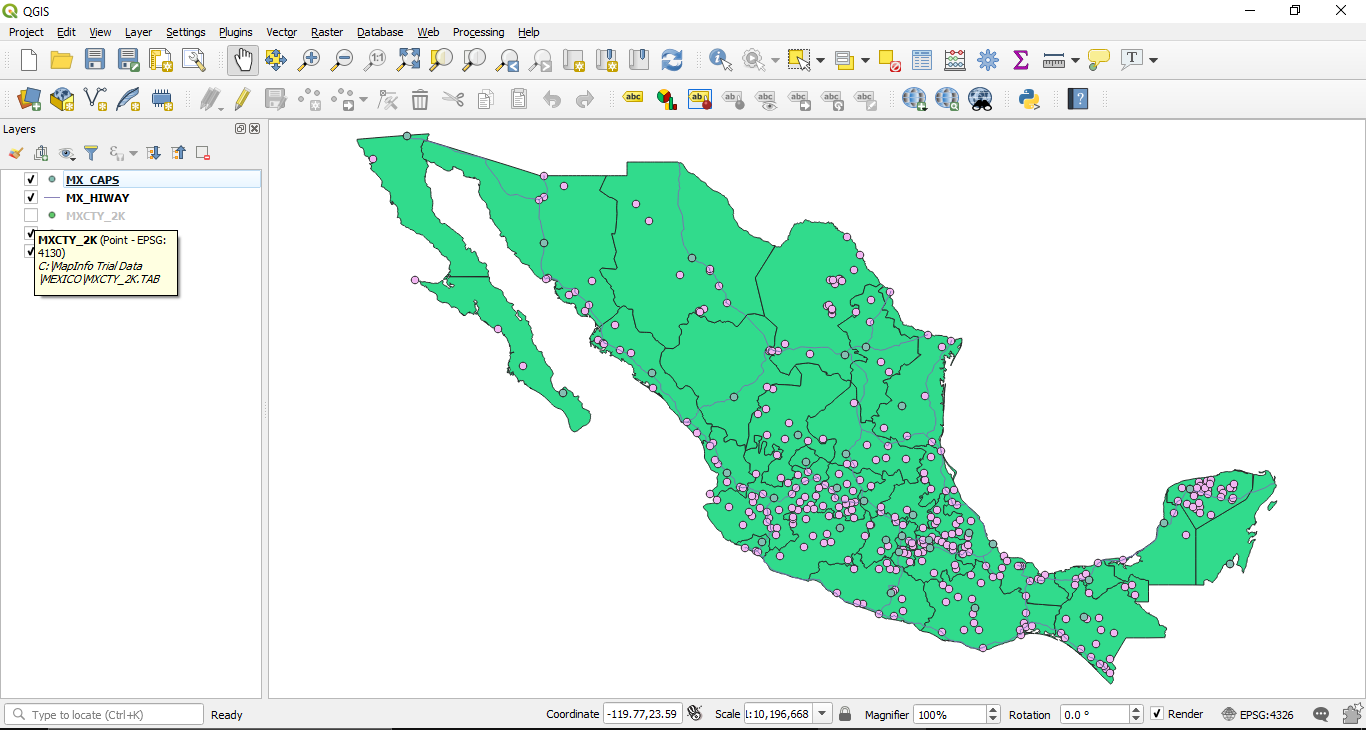
With this layer hidden, by clicking in the box next to the layer name, we can see the other layers more clearly making the map more informative. Alternatively, we could move the MXCTY_2K layer down to just above the MEXICO layer which will allow the layers above to display correctly.
Attached to each layer is an attribute table. An attribute table is very similar in appearance to the spreadsheet format. The attribute table for the MXCTY_2K is shown in the following screen shot.
Attached to each layer is an attribute table. An attribute table is very similar in appearance to the spreadsheet format. The attribute table for the MXCTY_2K is shown in the following screen shot.
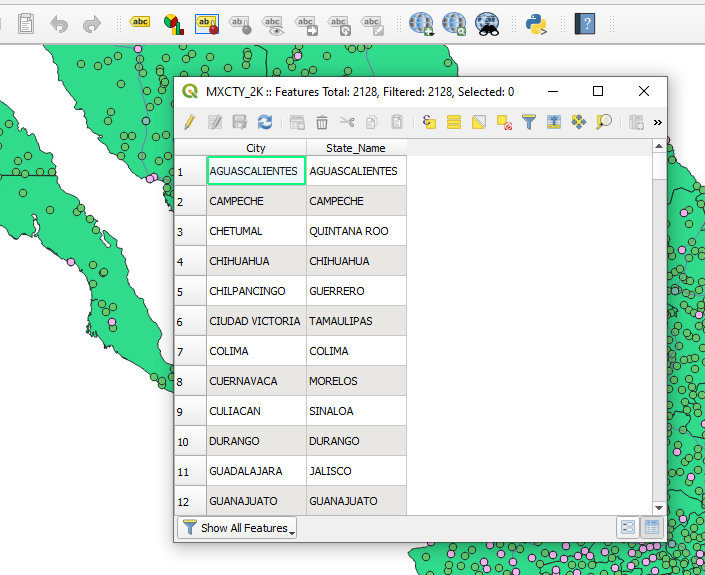
This attribute table contains 2128 records. Each record has two fields: City and State_Name. The attribute table has many useful features and can be used with many different aspects of the layer.
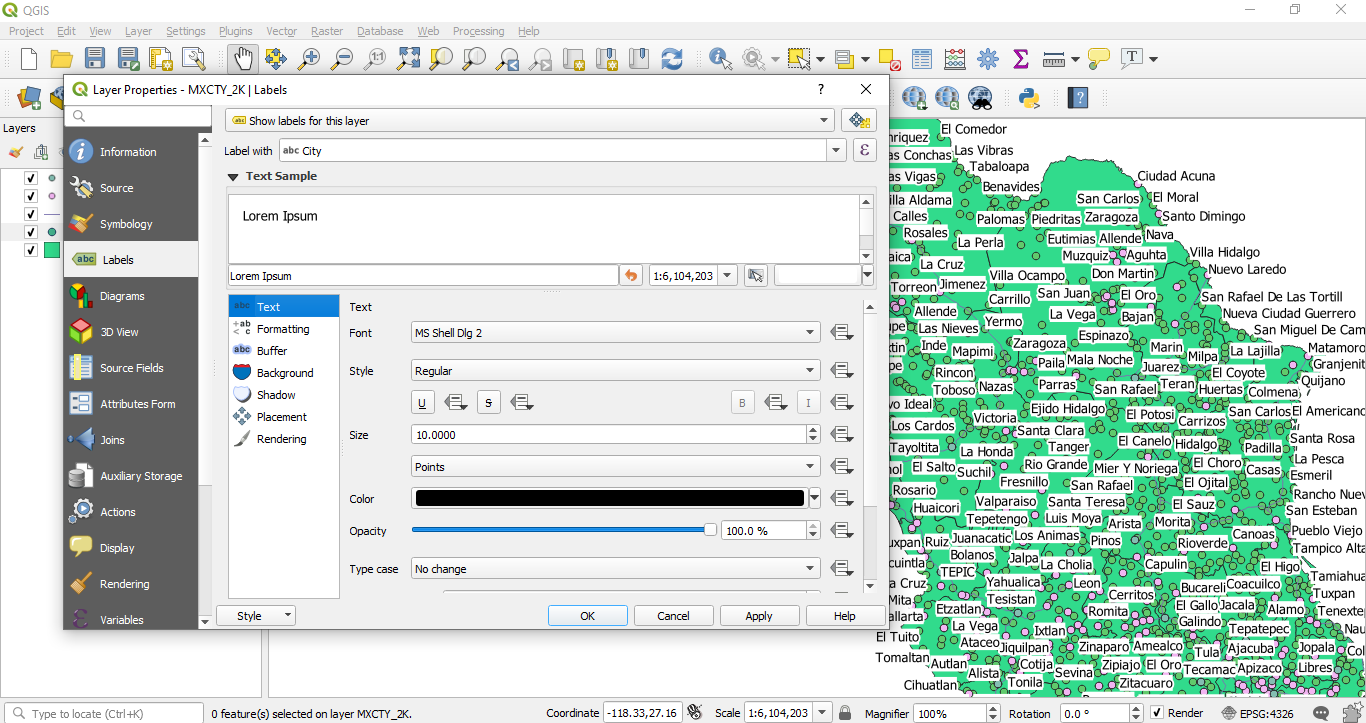
As well as the attribute table the layer also has a Layer dialogue box option as shown in the next screen shot. Here we can label the layer and carry out many other actions to enhance our map.
As well as the attribute table the layer also has a Layer dialogue box option as shown in the next screen shot. Here we can label the layer and carry out many other actions to enhance our map.
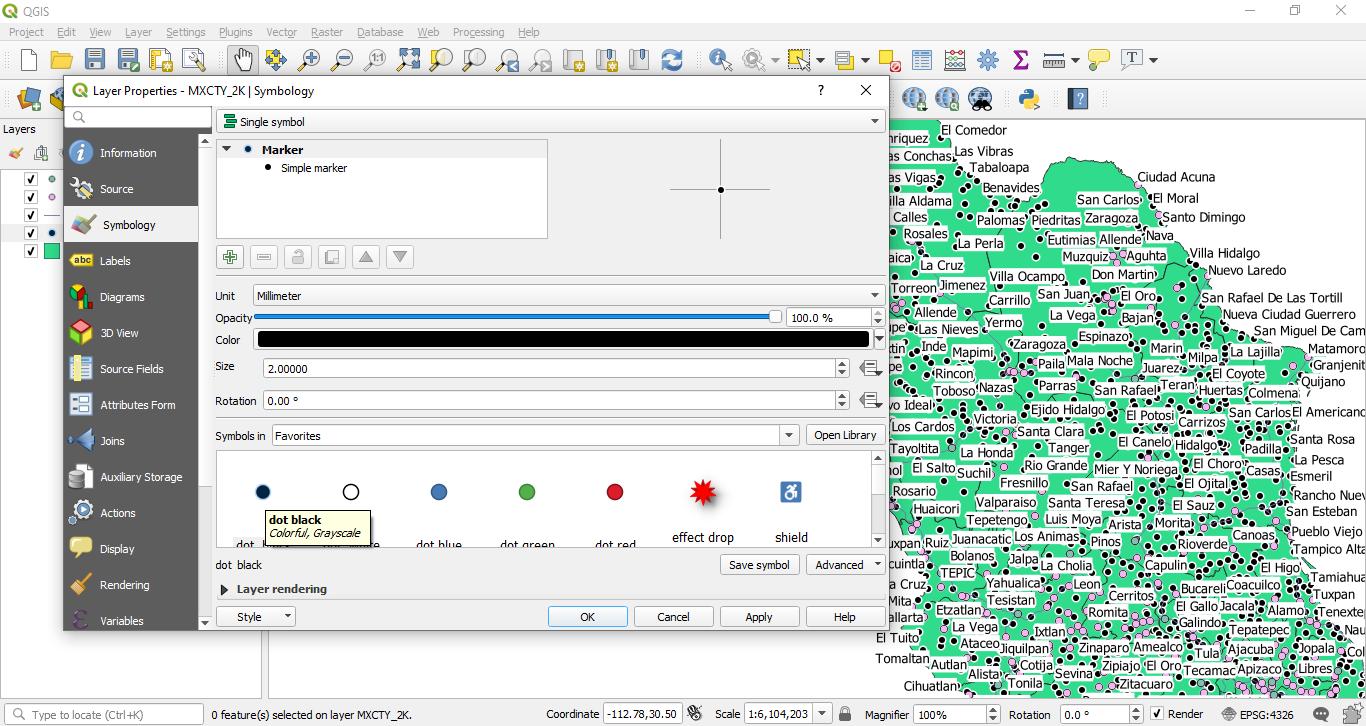
We can also change the symbol colour and size to make this layer stand out more clearly as shown in the next screen shot.
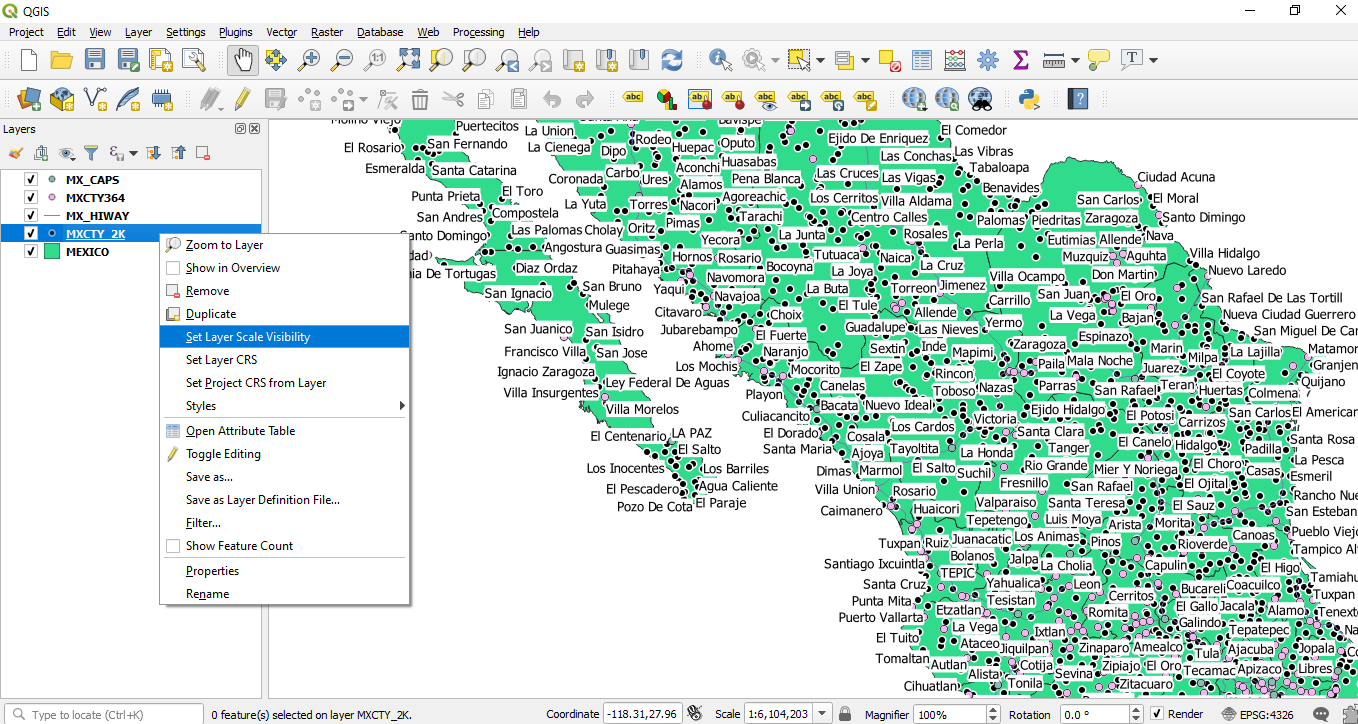
As the map is very busy with so many labels we could set the layer visibility so than the labels only show at a certain zoom level as shown in the next screen shot.
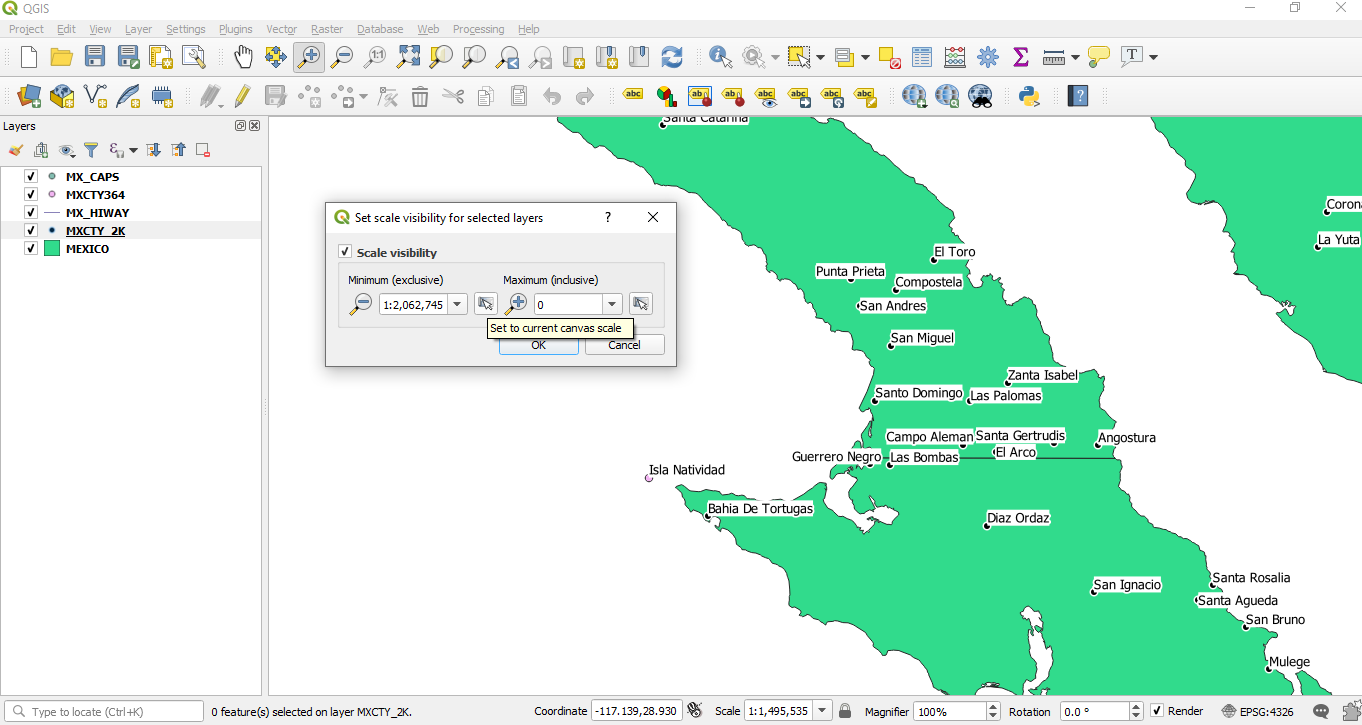
If we zoom into the map to a level at which you want labels to display for this layer, we can do this as shown in the next screen shot. Once we have set the layer display if we zoom out the labels will no longer display.
As you can see we have made a number of changes to this project in order to make the layer display as desired. Many more changes would probably be needed before these layers are acceptable.
In summary, we have seen why layer order is important to ensure that all the map layers display correctly. Each individual layer possesses properties which can be modified to make the final map display successfully. You can set layers to display their labels at certain zoom levels so as to ensure that the output is legible and not overcrowded.
Finally, each layer has an attribute table which looks similar to a spreadsheet. The attribute table can be used to interrogate the map and can be used to label the map with a specific field. In the above case we used the City field of the MXCTY_2K layer to display labels only at a specific zoom level.
 RSS Feed