If you are a new user of QGIS, you might be overwhelmed by the many data analysis tools available in the software. However, with a little bit of guidance and practice, you can unleash the power of QGIS to analyse and visualize spatial data effectively. In this blog, we will explore the fundamental data analysis techniques in QGIS, as well as some essential plugins that can help you maximize your GIS projects.
Before we dive into the specifics of QGIS data analysis, it is important to understand the basics of GIS and spatial data. GIS stands for Geographic Information System, which is a system designed to capture, store, manipulate, analyse, and display spatial or geographic data. Spatial data refers to any data that has a location component, such as a latitude and longitude or an address. Examples of spatial data include maps, satellite images, and point data representing locations of events or objects.
QGIS is an open-source GIS software that provides a wide range of data analysis and visualization tools. Some of the basic data analysis tools available in QGIS include:
Spatial queries
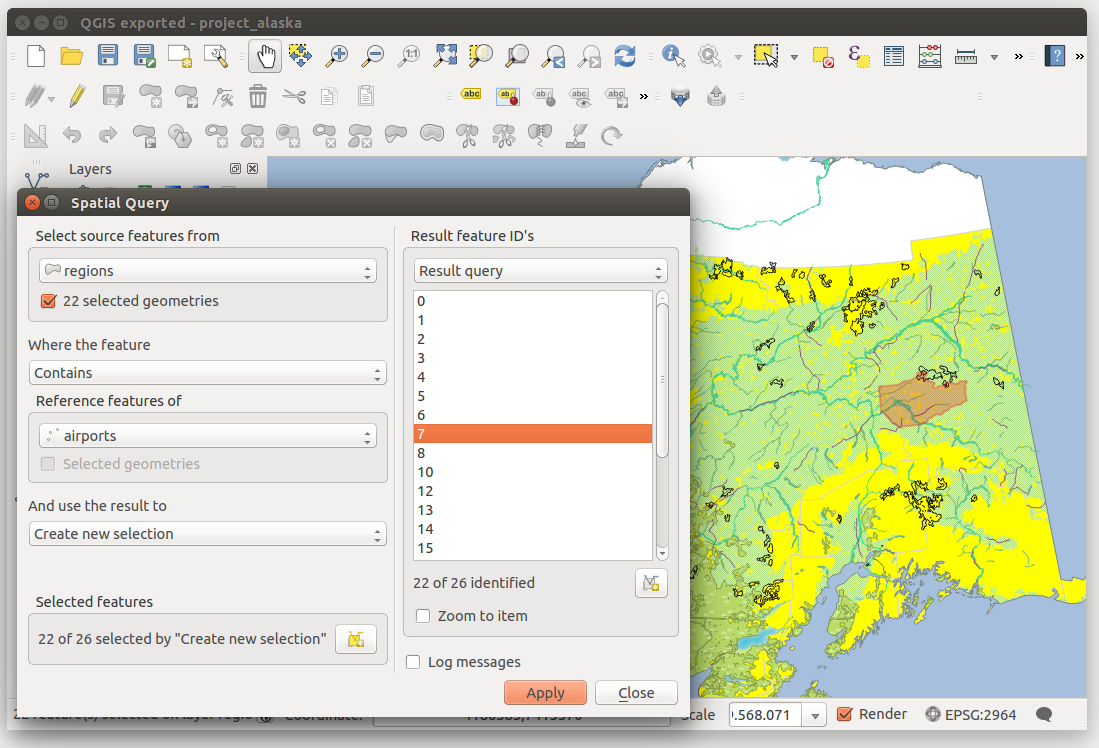
This core functionality allows you to filter data based on their location. For example, you can use spatial queries to select all the points within a certain distance from a given location or within a polygon. The above example selects all the airports in a specific region.
Vector analysis
Vector analysis
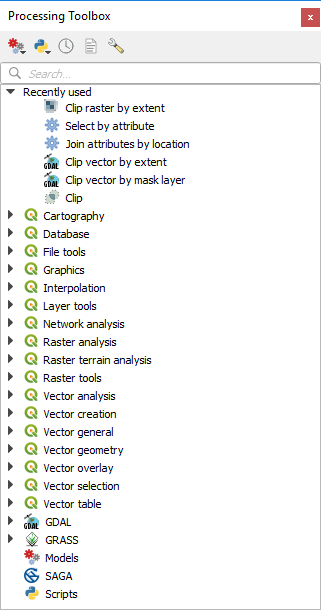
These toolbox features allow you to perform various vector-based analysis tasks, such as calculating distances between points, finding the nearest neighbour, and creating buffer zones around points.
Raster analysis
Raster analysis
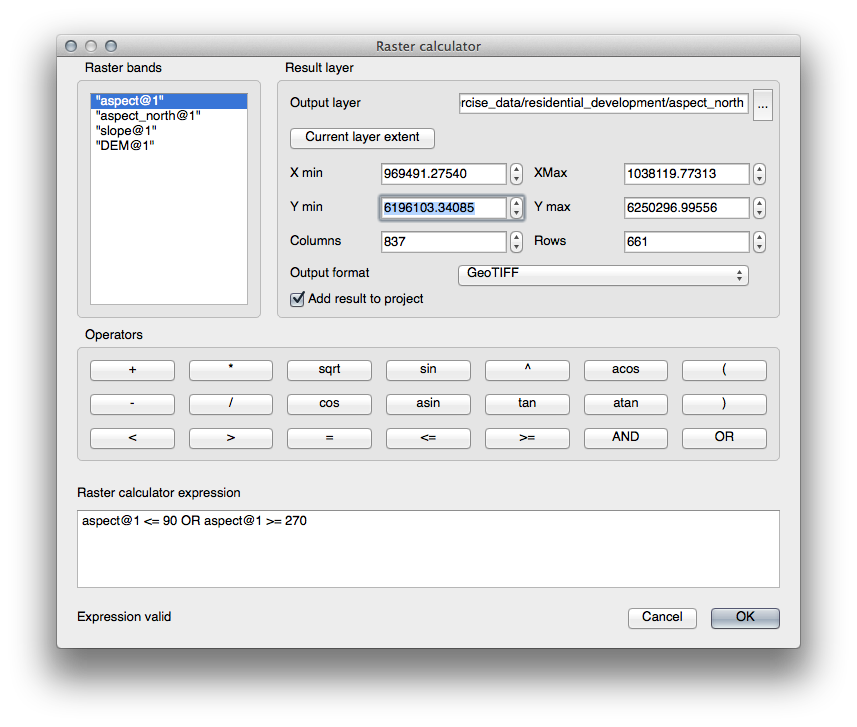
With core functionality tools such as the Raster Calculator you can perform various raster-based analysis tasks, such as creating a hill shade map, calculating slope, and performing map algebra operations.
In addition to these data analysis tools, QGIS also provides a vast array of plugins that can extend its capabilities. Some useful QGIS plugins for data analysis include:
QuickOSM
In addition to these data analysis tools, QGIS also provides a vast array of plugins that can extend its capabilities. Some useful QGIS plugins for data analysis include:
QuickOSM
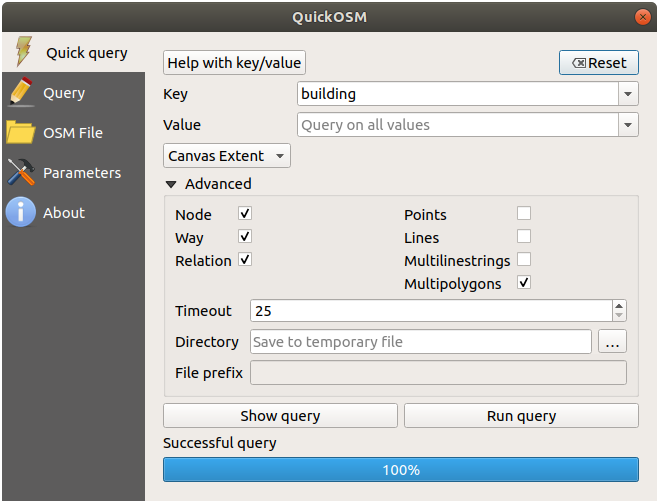
This plugin allows you to easily extract OpenStreetMap data and add them to your QGIS project.
Heatmap
Heatmap
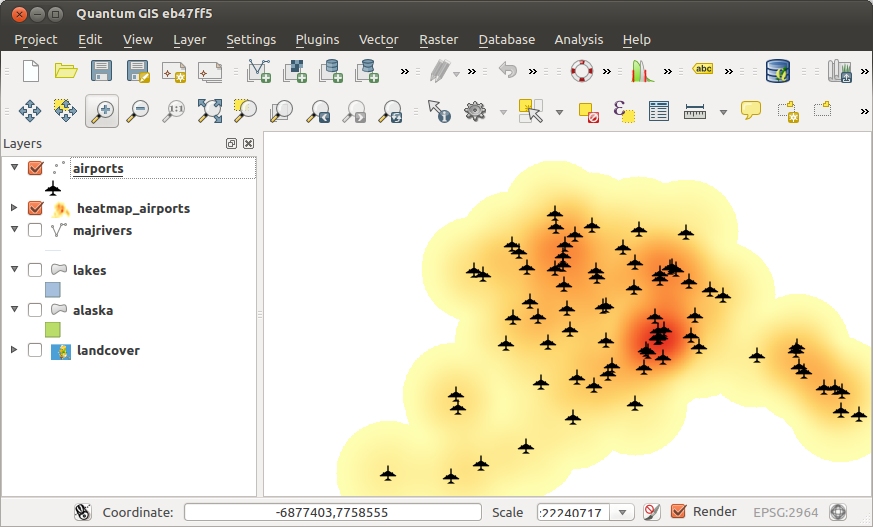
This plugin allows you to create a heatmap of point data, which can help you visualize the spatial distribution of data density.
QGIS2Web
QGIS2Web
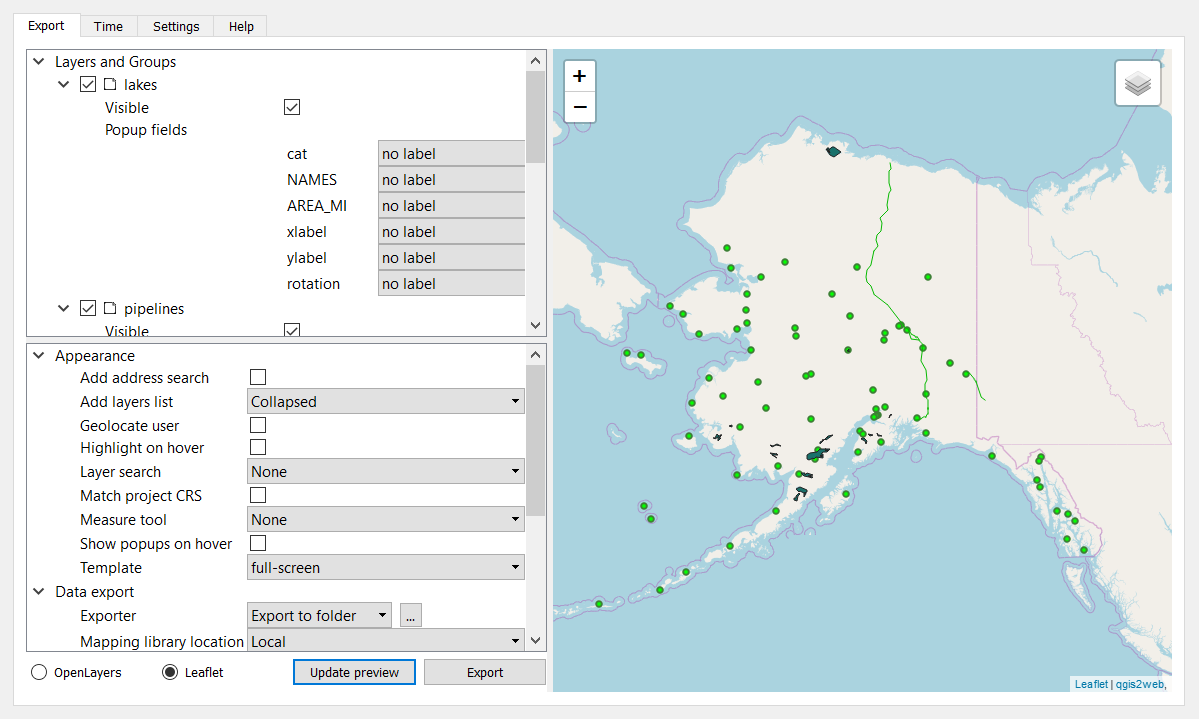
This plugin allows you to export your QGIS project as a web map, which can be shared on the internet.
In conclusion, QGIS provides a powerful set of tools for data analysis and visualization. As a new user, it might take some time to master these tools, but with practice and guidance, you can easily unlock the full potential of QGIS for your GIS projects.
In conclusion, QGIS provides a powerful set of tools for data analysis and visualization. As a new user, it might take some time to master these tools, but with practice and guidance, you can easily unlock the full potential of QGIS for your GIS projects.
 RSS Feed