jps services
  • Home Page
  • GIS Training Courses
    • QGIS Training Courses
    • ArcGIS Training Courses
    • MapInfo Pro Training Courses >
      • MapBasic Training Course
  • About
  • Blog

Disease, maps and geographic information systems

5/7/2012

0 Comments

 
Cholera was a devastating disease which killed thousands in London during the middle of the 1800’s.  Nobody at that time was sure of how this disease was transmitted.  Many felt that it was an air borne disease and  that it was coming from gaseous emissions caused by decaying matter.  Others thought that it was caused  microbes too small to be seen.  The actual cause was eventually discovered through the analytical scientific studies of John Snow.

John Snow came from humble labouring origins in York and was  the oldest of nine children.  He took three  apprenticeships with medical practitioners before obtaining  an MA at the University of London in 1844.  He was famous initially for the administration of chloroform to Queen Victoria during the births of her children.  Later when the cholera epidemic struck in 1853-54 he used his considerable intellectual skills to find the cause of the outbreak.  He was convinced that the disease was caused by microbes rather than gaseous emissions.  His views were initially resisted but over time the measures he proposed were accepted.  John noted that between two cholera outbreaks there was a change of water supply which was free from the sewage of London.  He noted that two water companies were supplying pumps within the same area. Through analysis of cholera deaths based on which water supply was used he was able to show that cholera was significantly higher in those drinking water that had been contaminated by sewage.  An outbreak of cholera in August 1854 was associated with a particular pump in Broad Street.  Again through analysis of deaths in the area John was able to show that the contaminated pump was the prime source of the outbreak.

John did not have the benefits of modern GIS systems to identify the cause of the cholera outbreaks.  However he used a map of the area to show that the those affected lived near the contaminated water supplies.  

Picture
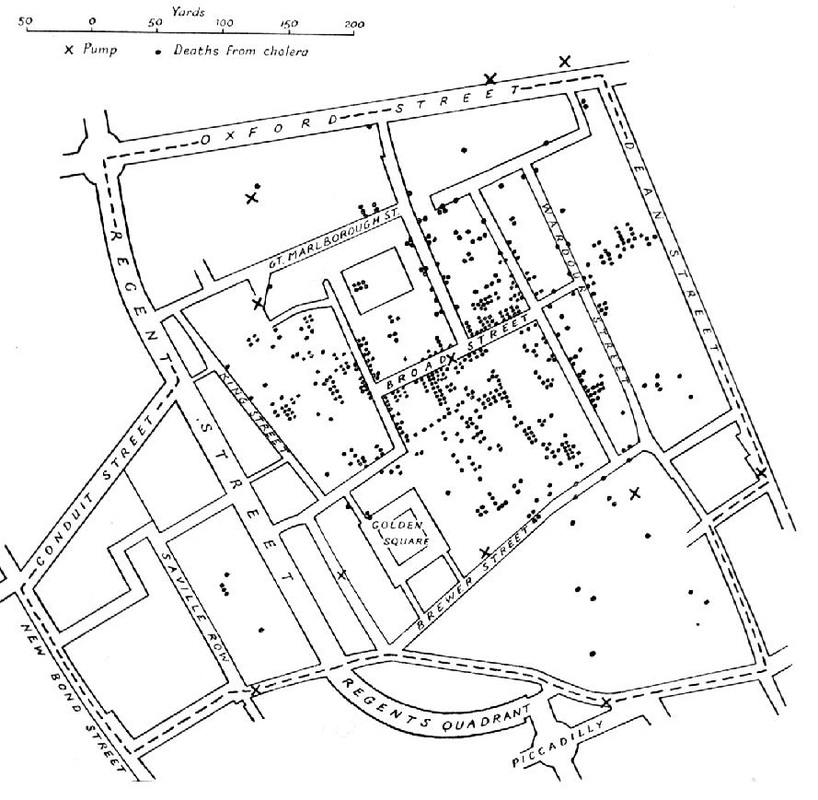
Cholera deaths near the Broad Street pump
By using maps of the Broad Street area John was able to show in a geographical form how the deaths were directly related to  the pump in that area.  Each death taken from tabular data was shown on the map.  This was an early example of the capabilities of  GIS in that the evidence of how this outbreak occurred could  be more easily understood by the locating each death on a map. 

Modern GIS systems such as QGIS offer organisations endless opportunities to investigate data via a map interface.  QGIS is opens source so is free to download.  Like most fully functional GIS systems QGIS requires some training to get most from the software. 

JPS Services offer one and two days' on-site  QGIS training courses which cover all the main functionality of the software.  We also offer on-line training courses if an on-site option is not feasible. For more information please complete the enquiry form.

0 Comments

Your comment will be posted after it is approved.


Leave a Reply.

    Author

    Joe Short BSc has been involved with various mapping solutions for over twenty years.  If you are considering implementing a GIS  or have ArcGIS Pro, MapInfo Pro or QGIS training requirements, jps services would be happy to be of assistance to your organisation. 

    Archives

    May 2025
    March 2025
    March 2024
    October 2023
    September 2023
    August 2023
    March 2023
    April 2020
    March 2020
    October 2019
    September 2019
    August 2019
    July 2019
    March 2019
    November 2018
    October 2018
    August 2018
    July 2018
    November 2017
    October 2017
    September 2017
    July 2017
    February 2017
    January 2017
    December 2016
    November 2016
    October 2016
    May 2016
    February 2016
    September 2015
    August 2015
    April 2015
    February 2015
    November 2014
    October 2014
    July 2014
    June 2014
    May 2014
    March 2014
    February 2014
    December 2013
    November 2013
    October 2013
    September 2013
    August 2013
    June 2013
    May 2013
    April 2013
    February 2013
    December 2012
    October 2012
    September 2012
    August 2012
    July 2012

    Categories

    All
    Arc Gis
    Arcview
    Autodesk
    Cad
    Gis Training
    Local Government
    Mapbasic
    Mapinfo
    Quantum Gis
    Relational Databases
    Saga Gis

    RSS Feed